


Ethereum is facing significant selling pressure.
According to the Binance chart screenshots from November 14, ETH is trading around $1,888, down approximately 3.41%, with its 24-hour low at $1,878.
What makes this move particularly important is that ETH is trading below MA(7), MA(25), and MA(99) across all four examined timeframes.
Let's examine the technical picture.
1. 15-Minute Chart: Sellers Remain in Control
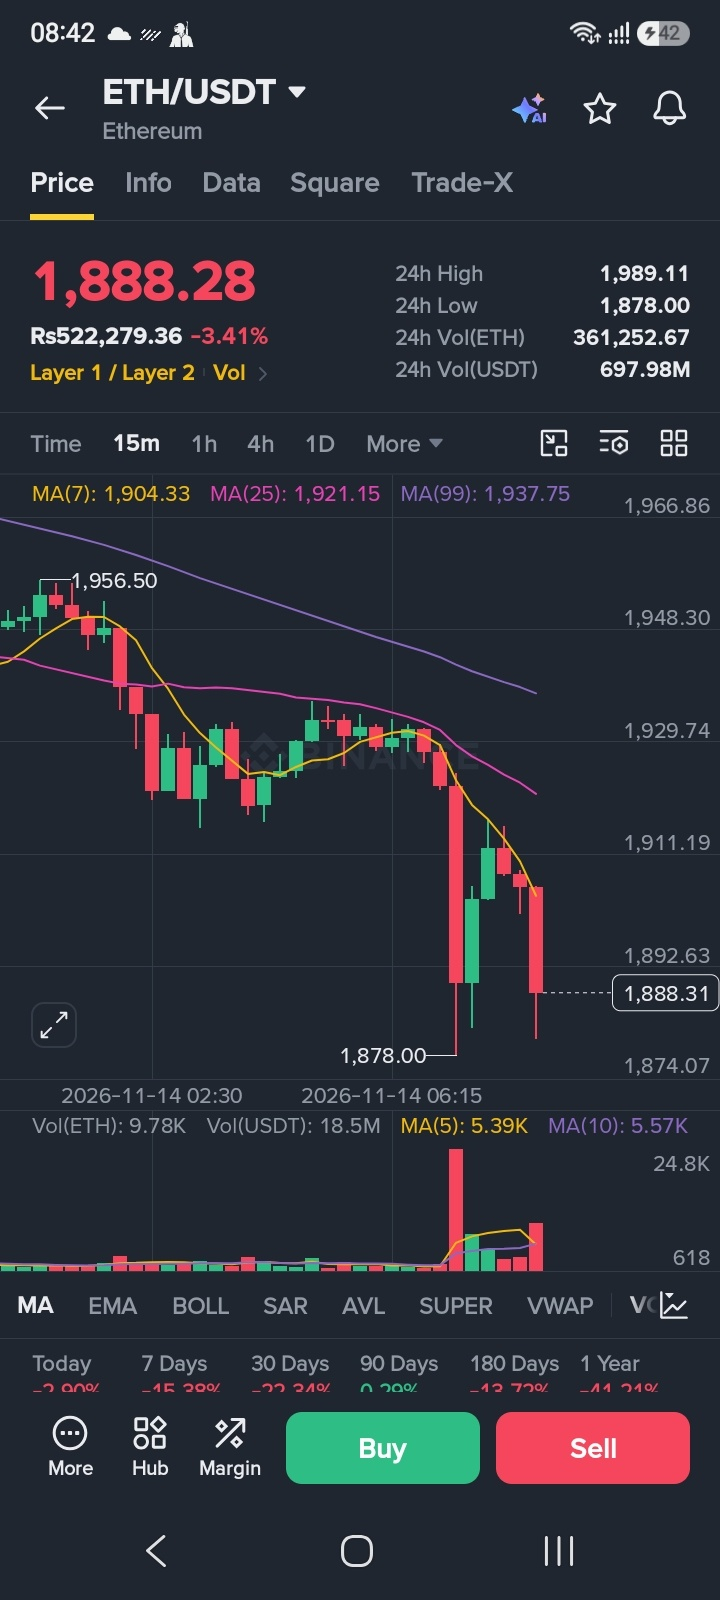
Moving Averages
MA(7): $1,904.33
MA(25): $1,921.15
MA(99): $1,937.75
ETH is below all three moving averages. Even the nearest MA(7) is above the current price, suggesting that short-term recovery attempts are facing resistance.
Volume
Candle volume: 9.78K ETH
MA(5): 5.39K
MA(10): 5.57K
Volume is significantly above both averages, indicating elevated trading activity during this decline.
2. 1-Hour Chart: Bearish Momentum Continues
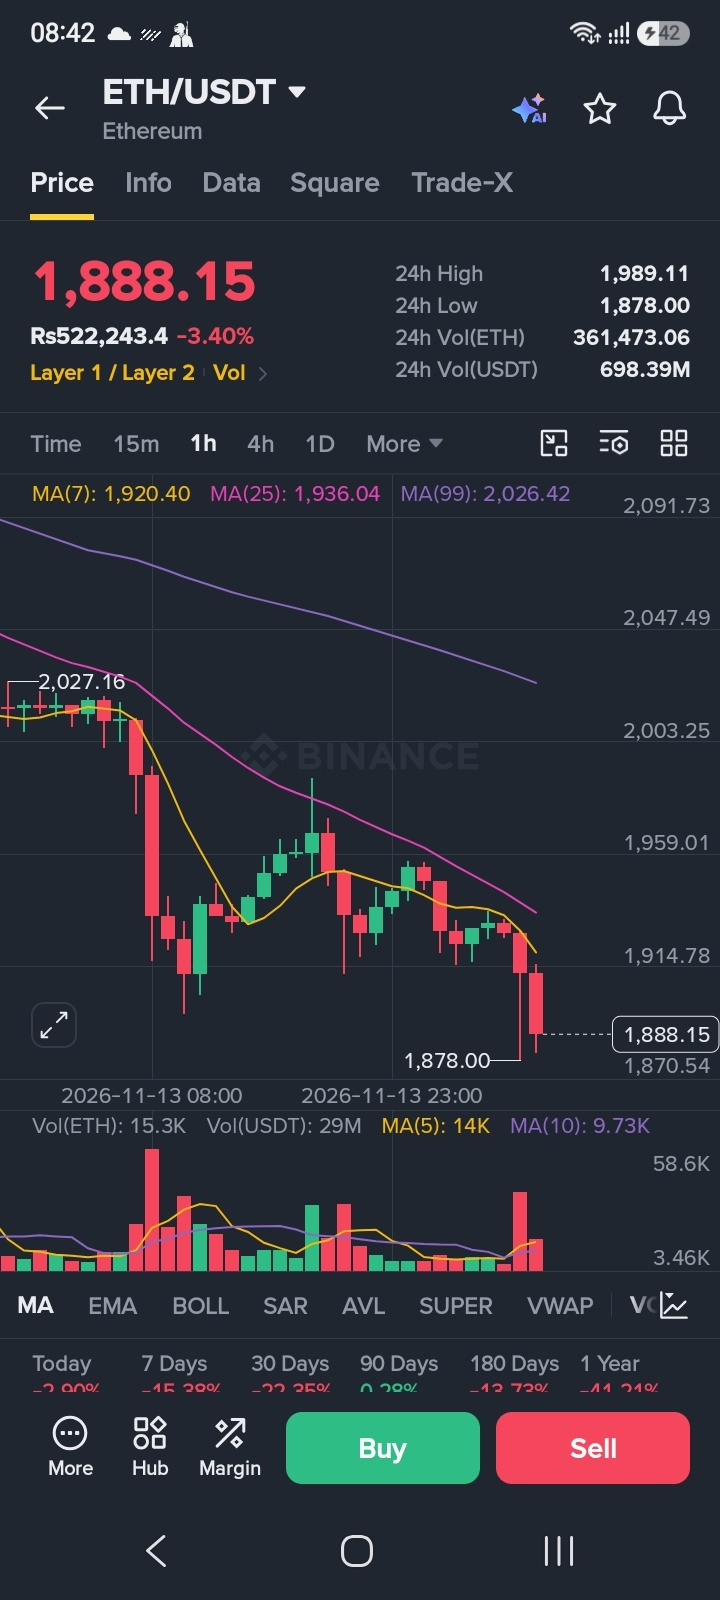
Moving Averages
MA(7): $1,920.40
MA(25): $1,936.04
MA(99): $2,026.42
All three averages remain above the current price. The gap between ETH and its MA(99) highlights the weakness in the broader hourly structure.
Volume
Candle volume: 15.3K ETH
MA(5): 14K
MA(10): 9.73K
Volume is above both averages, showing that market participation remains elevated.
3. 4-Hour Chart: A Major Recovery Challenge
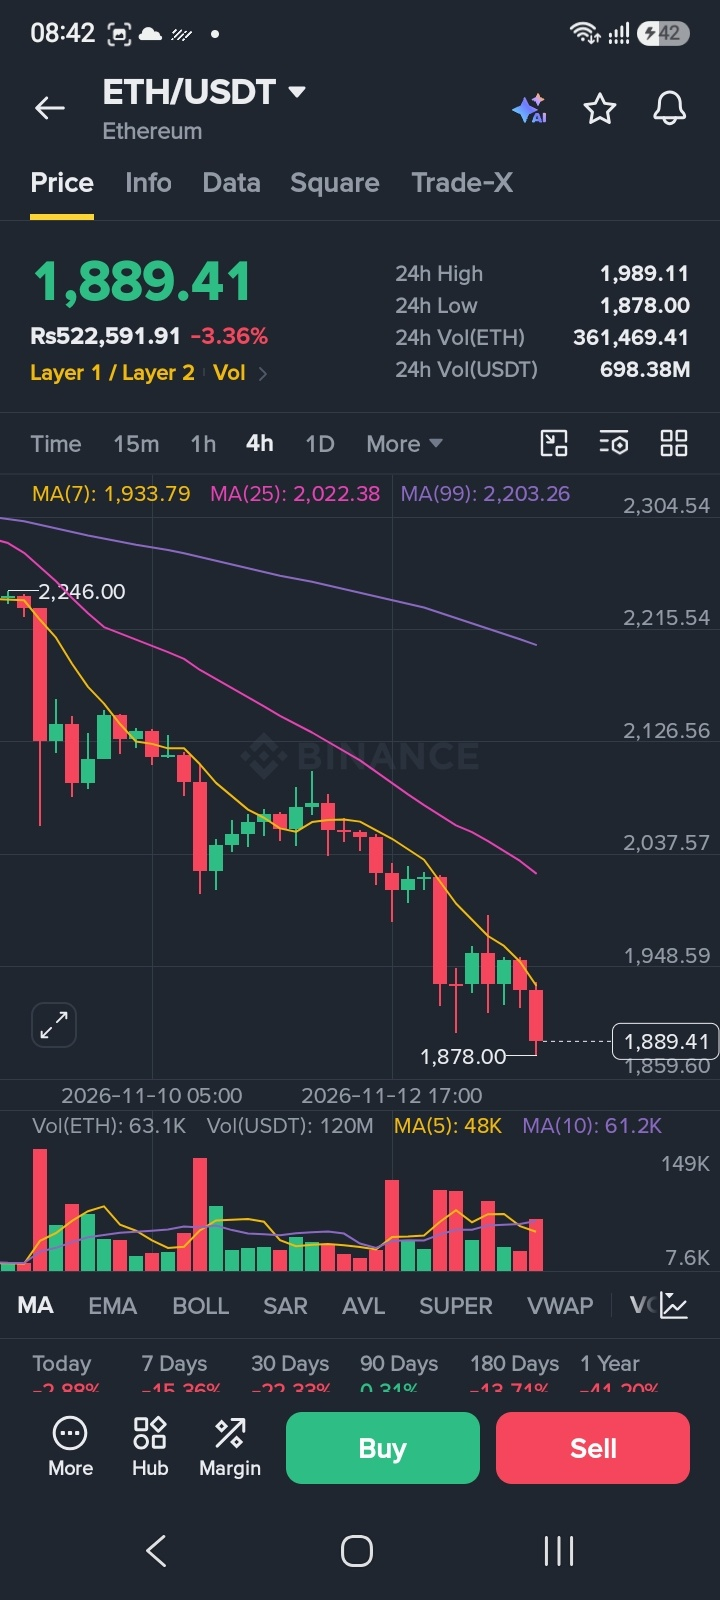
Moving Averages
MA(7): $1,933.79
MA(25): $2,022.38
MA(99): $2,203.26
The 4H chart remains weak, with ETH trading below all three moving averages.
A recovery above $1,933 would be an early improvement, but reclaiming the $2,022 area would be a much more significant technical development.
Volume
Candle volume: 63.1K ETH
MA(5): 48K
MA(10): 61.2K
Volume is above both averages, indicating relatively strong trading activity.
4. Daily Chart: The Bigger Trend Is Under Pressure
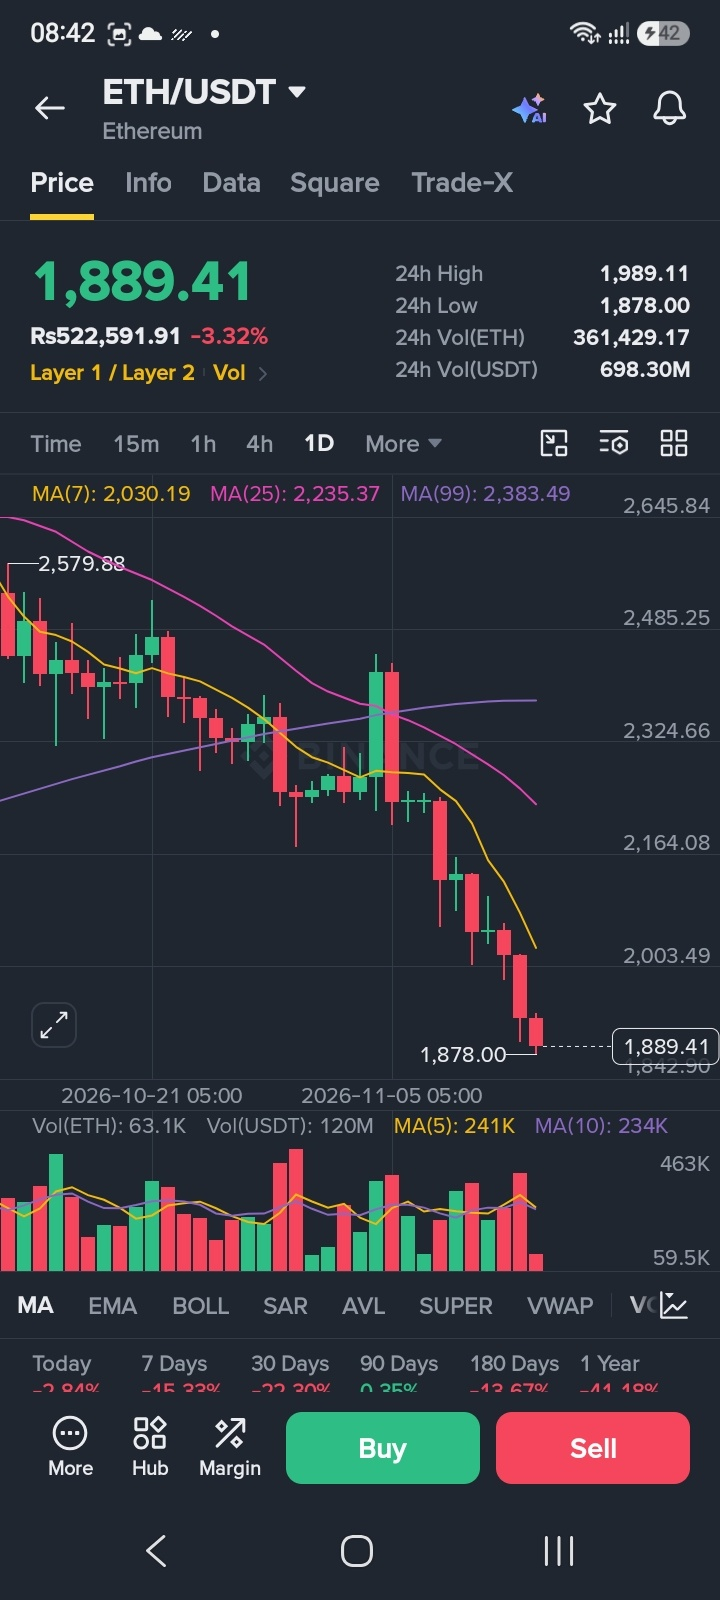
Moving Averages
MA(7): $2,030.19
MA(25): $2,235.37
MA(99): $2,383.49
The daily chart is particularly concerning.
ETH is trading considerably below all three moving averages. This indicates that the current weakness is not limited to a short-term correction.
Volume
Candle volume: 63.1K ETH
MA(5): 241K
MA(10): 234K
The displayed daily candle volume is below both averages. This reading should be interpreted carefully because the candle may still be developing.
Key Support and Resistance Levels
Support
$1,878 — Recent 24-hour low
$1,870.54 — Nearby chart level
$1,859.60 — Additional lower chart level
Resistance
$1,904–$1,921 — Short-term MA resistance zone
$1,933–$1,937 — Important 15m and 4H resistance
$2,026 — 1H MA(99)
$2,203 — 4H MA(99)
$2,235 — Daily MA(25)
What Could Happen Next?
Bullish recovery scenario: ETH needs to defend the $1,878 region and reclaim $1,904–$1,921. A stronger move above $1,937 could improve the short-term technical picture.
Bearish continuation scenario: If ETH breaks below $1,878 and fails to recover, traders may watch $1,870 and $1,859 as the next nearby levels.
Consolidation scenario: ETH could move sideways around the current support area while the market waits for stronger buying interest.
Final Verdict
Ethereum's current technical structure is bearish across all four timeframes.
The elevated volume on the 15m, 1H and 4H screenshots shows active trading during the decline, while the daily chart remains far below its major moving averages.
The immediate battle is around $1,878. Can buyers defend this level, or is another test of lower support ahead?
What is your expectation for ETH?
Recovery above $1,900.
Another breakdown below $1,878.
Sideways consolidation before the next major move.

Share your analysis in the comments!
Disclaimer: This article is for educational and informational purposes only, not financial advice. All technical readings are based on the Binance screenshots supplied on November 14, 2026, and are not guaranteed live prices.
#BinancePick #ETH #Ethereum #CryptoMarket #TechnicalAnalysis #Altcoins #cryptotrading