
$quq : Tiny Price Moves, But Is a Breakout Brewing?
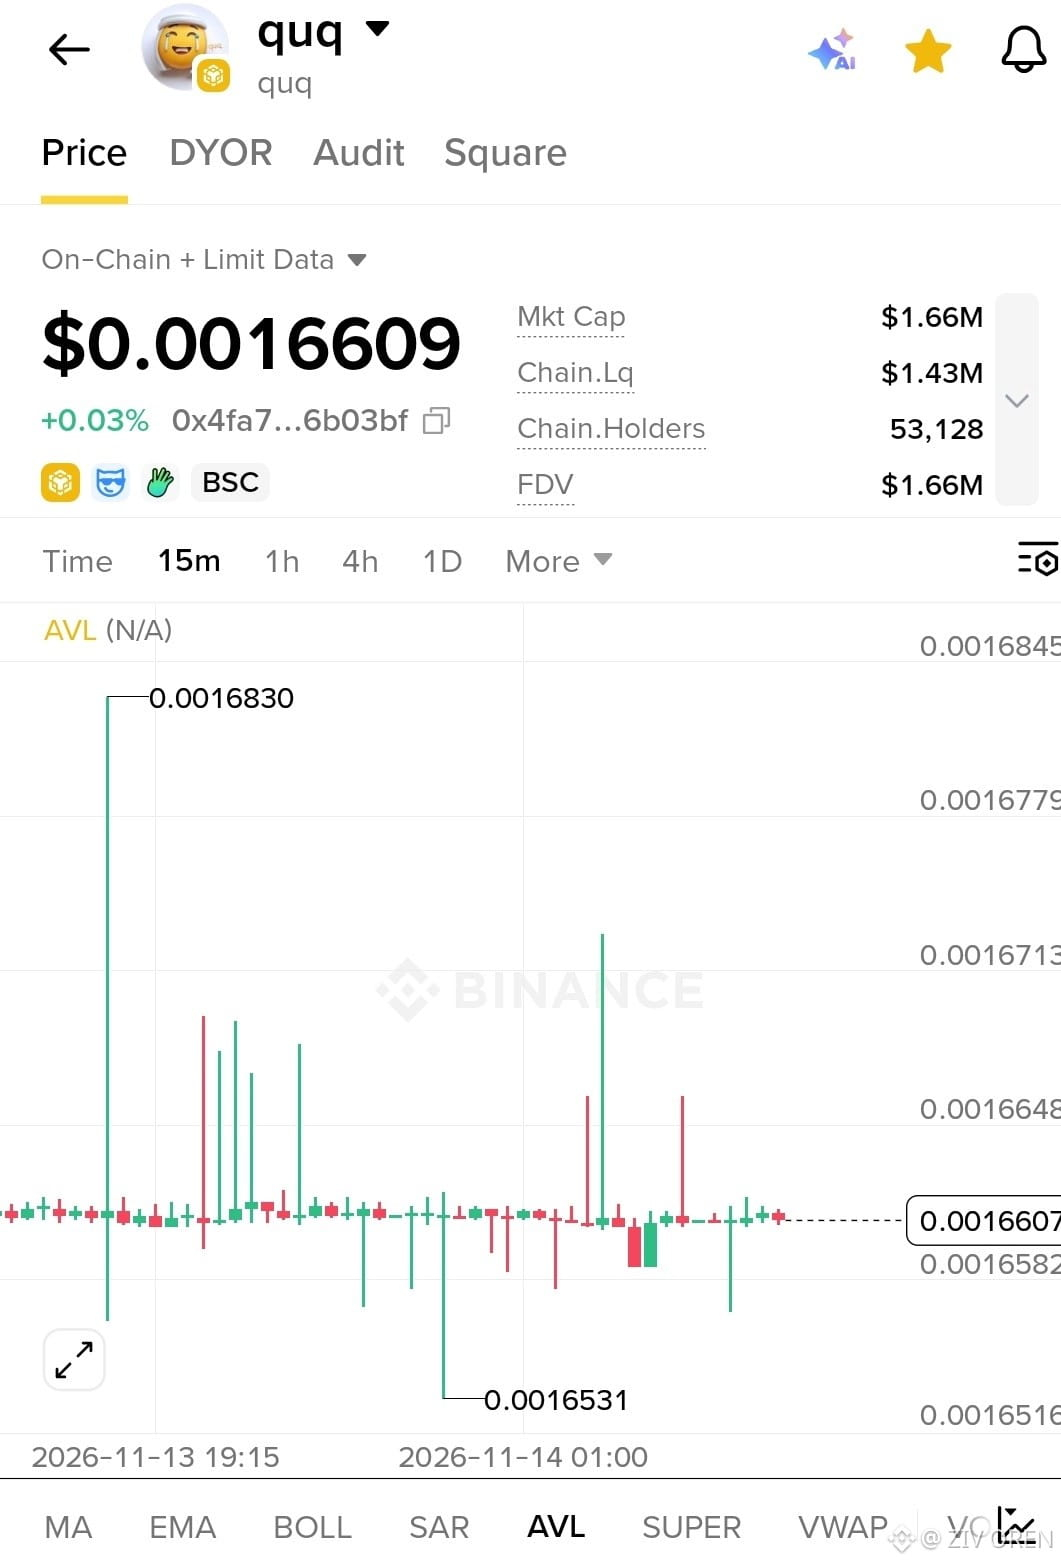
$QUQ is trading around $0.0016609 on the 15-minute chart, with price showing almost no net change at +0.03%. Despite a few sharp wicks, the token remains trapped in a narrow range. I’m watching for a decisive move rather than assuming the next spike will hold.
The immediate resistance zone sits around $0.0016648–$0.0016713, with a higher spike recorded at $0.0016830. On the downside, $0.0016582 is the first level to watch, followed by the recent low at $0.0016531. A clean break above resistance could signal renewed buying interest, while losing support would weaken the short-term setup.
The on-screen data shows a $1.66M market cap, $1.43M in chain liquidity, and 53,128 holders. These figures provide useful context, but the chart alone doesn’t confirm sustained volume or new buying pressure. The long wicks also suggest that individual price moves may be sharp in this range.
My Trading Plan
I’m not entering just because of a sudden wick. I’d prefer to see $QUQ break above $0.0016713, hold that level on a retest, and show stronger buying activity before considering a spot entry.
For DCA, I’d wait for price to stabilize near support rather than buying automatically at every dip. A sustained move below $0.0016531 would invalidate this short-term bullish idea and make me step back.
The key level is confirmation, not speculation. I’m watching whether $QUQ can break out of this tight range with genuine buying pressure—or whether the price remains stuck in consolidation.
$QUQ is trading around $0.0016609 on the 15-minute chart, with price showing almost no net change at +0.03%. Despite a few sharp wicks, the token remains trapped in a narrow range. I’m watching for a decisive move rather than assuming the next spike will hold.
The immediate resistance zone sits around $0.0016648–$0.0016713, with a higher spike recorded at $0.0016830. On the downside, $0.0016582 is the first level to watch, followed by the recent low at $0.0016531. A clean break above resistance could signal renewed buying interest, while losing support would weaken the short-term setup.
The on-screen data shows a $1.66M market cap, $1.43M in chain liquidity, and 53,128 holders. These figures provide useful context, but the chart alone doesn’t confirm sustained volume or new buying pressure. The long wicks also suggest that individual price moves may be sharp in this range.
My Trading Plan
I’m not entering just because of a sudden wick. I’d prefer to see $QUQ break above $0.0016713, hold that level on a retest, and show stronger buying activity before considering a spot entry.
For DCA, I’d wait for price to stabilize near support rather than buying automatically at every dip. A sustained move below $0.0016531 would invalidate this short-term bullish idea and make me step back.
The key level is confirmation, not speculation. I’m watching whether $QUQ can break out of this tight range with genuine buying pressure—or whether the price remains stuck in consolidation.