$SNXXB : SNXXB: Does Fast‑Drop or Slow‑Bleed Shape the Next Move?
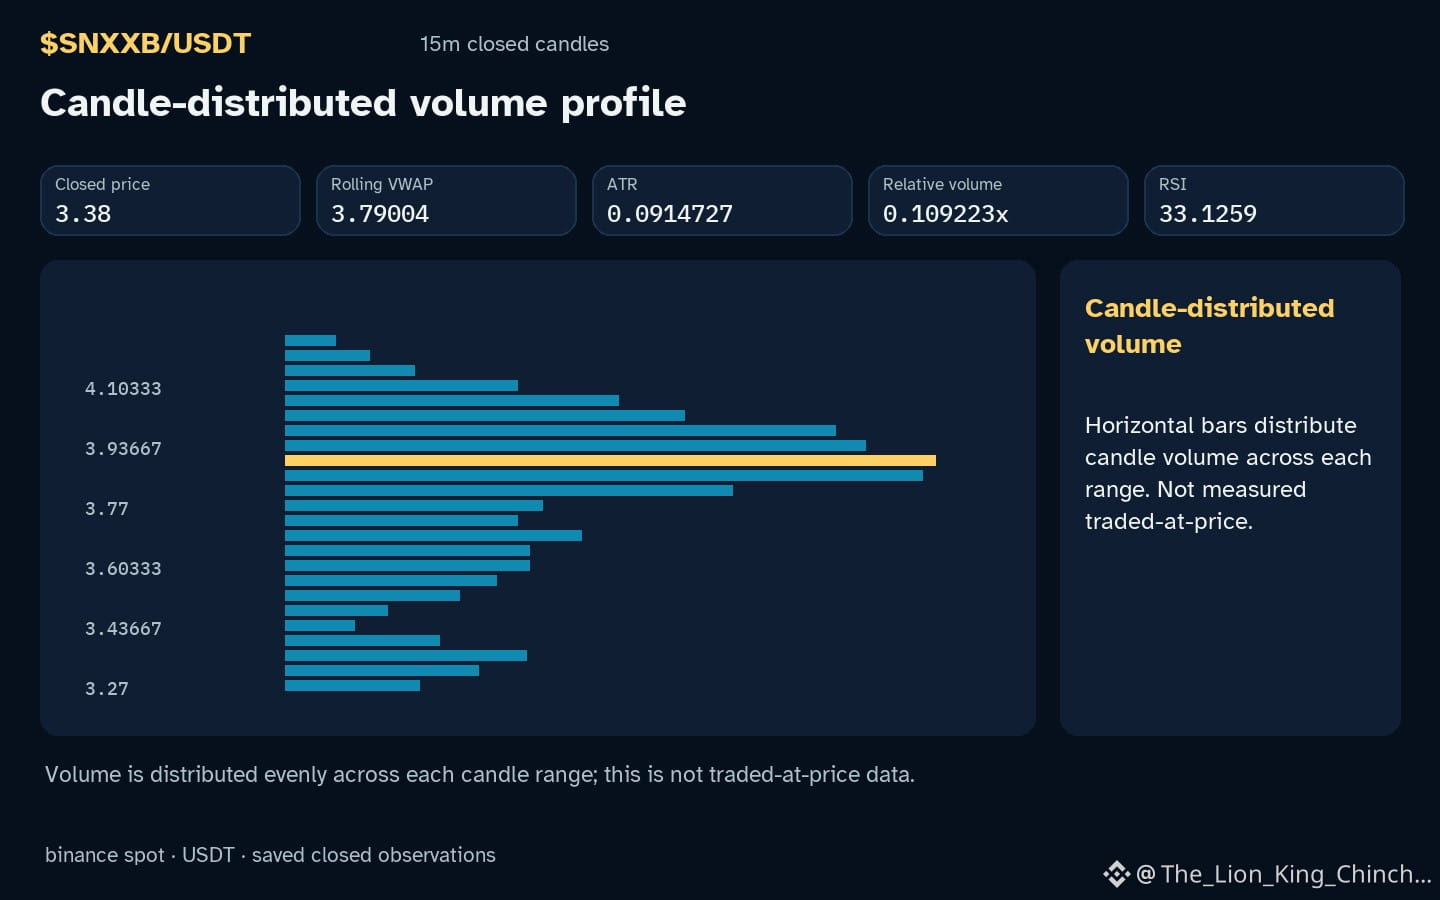
Why does $SNXXB show an hourly up direction while volume stays 0.11x baseline? The observation points to a price rise inside its recorded range, yet the lack of elevated volume raises a question about the velocity versus the duration of any underlying selling pressure.
One possible clue is that a brief, high‑speed sell‑off can leave the price only slightly lower before buyers push it back, creating a narrow candle that still closes higher. In that scenario the short‑lived pressure would be invisible in the volume metric because the total traded amount stays near baseline. An alternative reading is that a prolonged, low‑intensity drain may erode support over several candles, producing a series of modestly bearish moves that collectively outweigh a single sharp drop. This slower bleed would also keep volume modest, but the cumulative effect could be seen in a gradual narrowing of the range and a weakening of the RSI 33.1.
Both interpretations are limited by the single‑candle snapshot. A future closed‑candle that shows a sustained decline in price while the relative volume remains low would weaken the fast‑drop hypothesis. Conversely, a sudden spike in relative volume accompanying a sharp pull‑back would challenge the slow‑bleed view. Monitoring how the range evolves and whether the RSI moves lower will help reassess which mechanism is more plausible.
Probabilistic market research, not a recommendation or guaranteed return.
#SNXXB #MarketAnalysis
Why does $SNXXB show an hourly up direction while volume stays 0.11x baseline? The observation points to a price rise inside its recorded range, yet the lack of elevated volume raises a question about the velocity versus the duration of any underlying selling pressure.
One possible clue is that a brief, high‑speed sell‑off can leave the price only slightly lower before buyers push it back, creating a narrow candle that still closes higher. In that scenario the short‑lived pressure would be invisible in the volume metric because the total traded amount stays near baseline. An alternative reading is that a prolonged, low‑intensity drain may erode support over several candles, producing a series of modestly bearish moves that collectively outweigh a single sharp drop. This slower bleed would also keep volume modest, but the cumulative effect could be seen in a gradual narrowing of the range and a weakening of the RSI 33.1.
Both interpretations are limited by the single‑candle snapshot. A future closed‑candle that shows a sustained decline in price while the relative volume remains low would weaken the fast‑drop hypothesis. Conversely, a sudden spike in relative volume accompanying a sharp pull‑back would challenge the slow‑bleed view. Monitoring how the range evolves and whether the RSI moves lower will help reassess which mechanism is more plausible.
Probabilistic market research, not a recommendation or guaranteed return.
#SNXXB #MarketAnalysis