🔥 $SOL Technical Update: Key Levels & Momentum Breakdown
📊 1. Market Snapshot
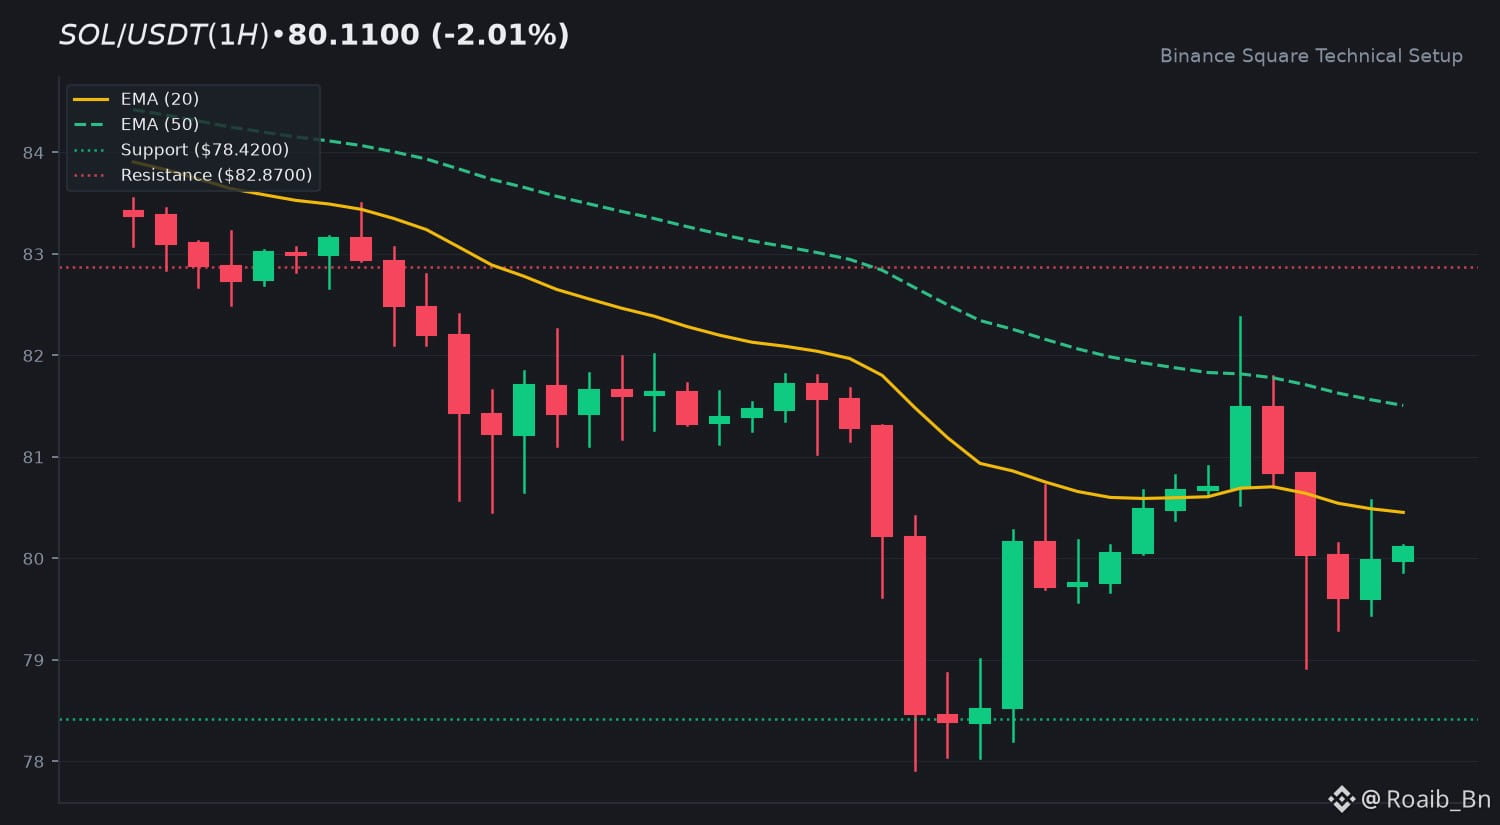
$SOL is currently trading at 80.1100 USDT, reflecting a 24h change of -2.01%. Market activity remains subdued with a 24h quote volume of approximately 272.68 million USDT. The volume-to-SMA ratio sits at 0.09x, indicating low market conviction and a phase of consolidation.
📈 2. Technical Momentum & Indicator Bias
The price action for $SOL remains beneath both the EMA 20 at 80.4535 and the EMA 50 at 81.5073. This positioning confirms a persistent downtrend bias. The RSI at 44.71 suggests neutral momentum, neither overbought nor oversold. Meanwhile, the MACD histogram shows a marginal positive value of 0.0926, though the MACD line remains below the signal line, suggesting that buyers are struggling to establish sustained upward pressure.
🎯 3. Key Technical Levels to Watch
• 🟢 Resistance Zone: Immediate resistance is located at 82.8700, with secondary resistance extending toward 86.2300.
• 🔴 Support Zone: The primary support floor is established at 78.4200.
• 🛡️ Pivot Confluence: Traders are monitoring the 80.4500 area, as reclaiming the EMA 20 is essential for a shift in short-term momentum.
💡 4. Technical Takeaway & Risk Management
The current environment reflects low-volume consolidation. Participants are observing whether $SOL can reclaim the EMA 20 dynamic resistance or if it will continue to test the lower support floor. Risk management remains critical given the lack of strong volume conviction.
💬 5. Community Discussion
What is your technical outlook for $SOL this week? Are you observing the support levels for signs of exhaustion or waiting for a clean break above the EMA 50? Drop your thoughts below! 👇
⚠️ 6. Disclaimer
Educational technical analysis only. Not financial advice (NFA). Crypto markets involve risk. Always DYOR.
$SOL #SOL #BinanceSquare
📊 1. Market Snapshot
$SOL is currently trading at 80.1100 USDT, reflecting a 24h change of -2.01%. Market activity remains subdued with a 24h quote volume of approximately 272.68 million USDT. The volume-to-SMA ratio sits at 0.09x, indicating low market conviction and a phase of consolidation.
📈 2. Technical Momentum & Indicator Bias
The price action for $SOL remains beneath both the EMA 20 at 80.4535 and the EMA 50 at 81.5073. This positioning confirms a persistent downtrend bias. The RSI at 44.71 suggests neutral momentum, neither overbought nor oversold. Meanwhile, the MACD histogram shows a marginal positive value of 0.0926, though the MACD line remains below the signal line, suggesting that buyers are struggling to establish sustained upward pressure.
🎯 3. Key Technical Levels to Watch
• 🟢 Resistance Zone: Immediate resistance is located at 82.8700, with secondary resistance extending toward 86.2300.
• 🔴 Support Zone: The primary support floor is established at 78.4200.
• 🛡️ Pivot Confluence: Traders are monitoring the 80.4500 area, as reclaiming the EMA 20 is essential for a shift in short-term momentum.
💡 4. Technical Takeaway & Risk Management
The current environment reflects low-volume consolidation. Participants are observing whether $SOL can reclaim the EMA 20 dynamic resistance or if it will continue to test the lower support floor. Risk management remains critical given the lack of strong volume conviction.
💬 5. Community Discussion
What is your technical outlook for $SOL this week? Are you observing the support levels for signs of exhaustion or waiting for a clean break above the EMA 50? Drop your thoughts below! 👇
⚠️ 6. Disclaimer
Educational technical analysis only. Not financial advice (NFA). Crypto markets involve risk. Always DYOR.
$SOL #SOL #BinanceSquare