$DODO: Why the Same Move Can Feel Large or Small
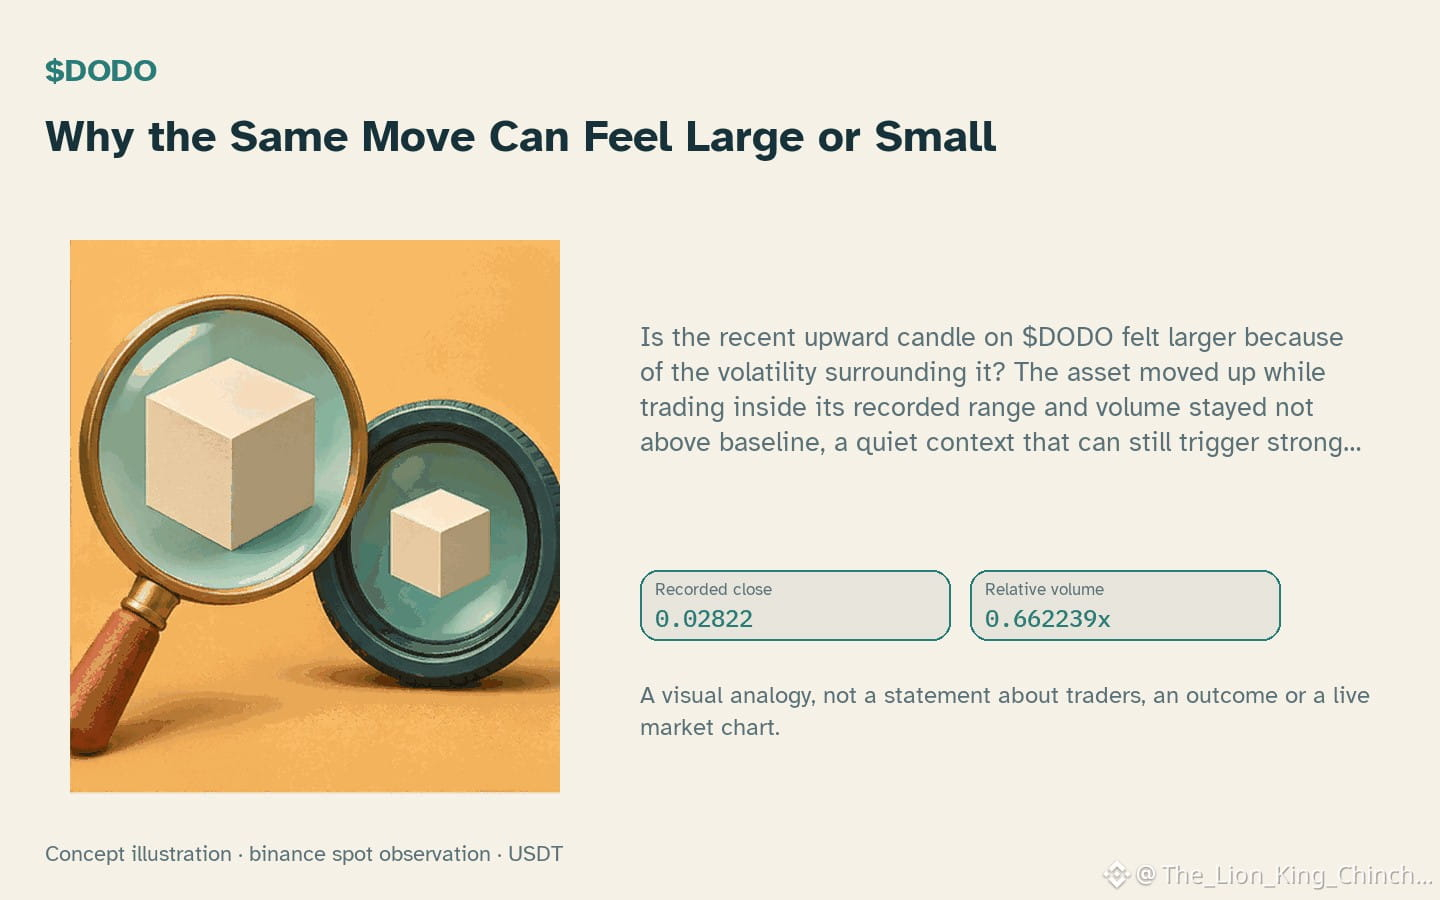
Is the recent upward candle on $DODO felt larger because of the volatility surrounding it? The asset moved up while trading inside its recorded range and volume stayed not above baseline, a quiet context that can still trigger strong perception shifts.
When traders focus on the most recent price jump, anchoring bias may cause them to treat that move as the new reference point, ignoring the broader range that still contains the price. The quiet volume reinforces the illusion that the price action is more decisive than it truly is. This creates a perceptual distortion where the same magnitude feels either dramatic or negligible depending on the mental anchor.
An alternative view notes that the modest 0.66x baseline and a neutral 49.3 suggest limited momentum, warning against over‑interpreting the move. A counterexample would be a similar up candle accompanied by a sharp volume surge, which would likely diminish the distortion.
Practical self‑check: before reacting, pause and compare the candle to the local support and resistance levels (0.02741 and 0.02967). Ask whether the price shift changes the overall range or merely rides within it. If the next closed candle shows a pull‑back into the same range, the initial perception was likely inflated.
Probabilistic market research, not a recommendation or guaranteed return.
The comparison to keep in mind: $BTC has hourly direction down and volume not above its baseline; $SOPH has hourly direction up and volume above its baseline. This alone does not establish correlation.
#DODO #BTC #SOPH
Is the recent upward candle on $DODO felt larger because of the volatility surrounding it? The asset moved up while trading inside its recorded range and volume stayed not above baseline, a quiet context that can still trigger strong perception shifts.
When traders focus on the most recent price jump, anchoring bias may cause them to treat that move as the new reference point, ignoring the broader range that still contains the price. The quiet volume reinforces the illusion that the price action is more decisive than it truly is. This creates a perceptual distortion where the same magnitude feels either dramatic or negligible depending on the mental anchor.
An alternative view notes that the modest 0.66x baseline and a neutral 49.3 suggest limited momentum, warning against over‑interpreting the move. A counterexample would be a similar up candle accompanied by a sharp volume surge, which would likely diminish the distortion.
Practical self‑check: before reacting, pause and compare the candle to the local support and resistance levels (0.02741 and 0.02967). Ask whether the price shift changes the overall range or merely rides within it. If the next closed candle shows a pull‑back into the same range, the initial perception was likely inflated.
Probabilistic market research, not a recommendation or guaranteed return.
The comparison to keep in mind: $BTC has hourly direction down and volume not above its baseline; $SOPH has hourly direction up and volume above its baseline. This alone does not establish correlation.
#DODO #BTC #SOPH