$AMDB : Questioning the Certainty of Liquidation Spirals
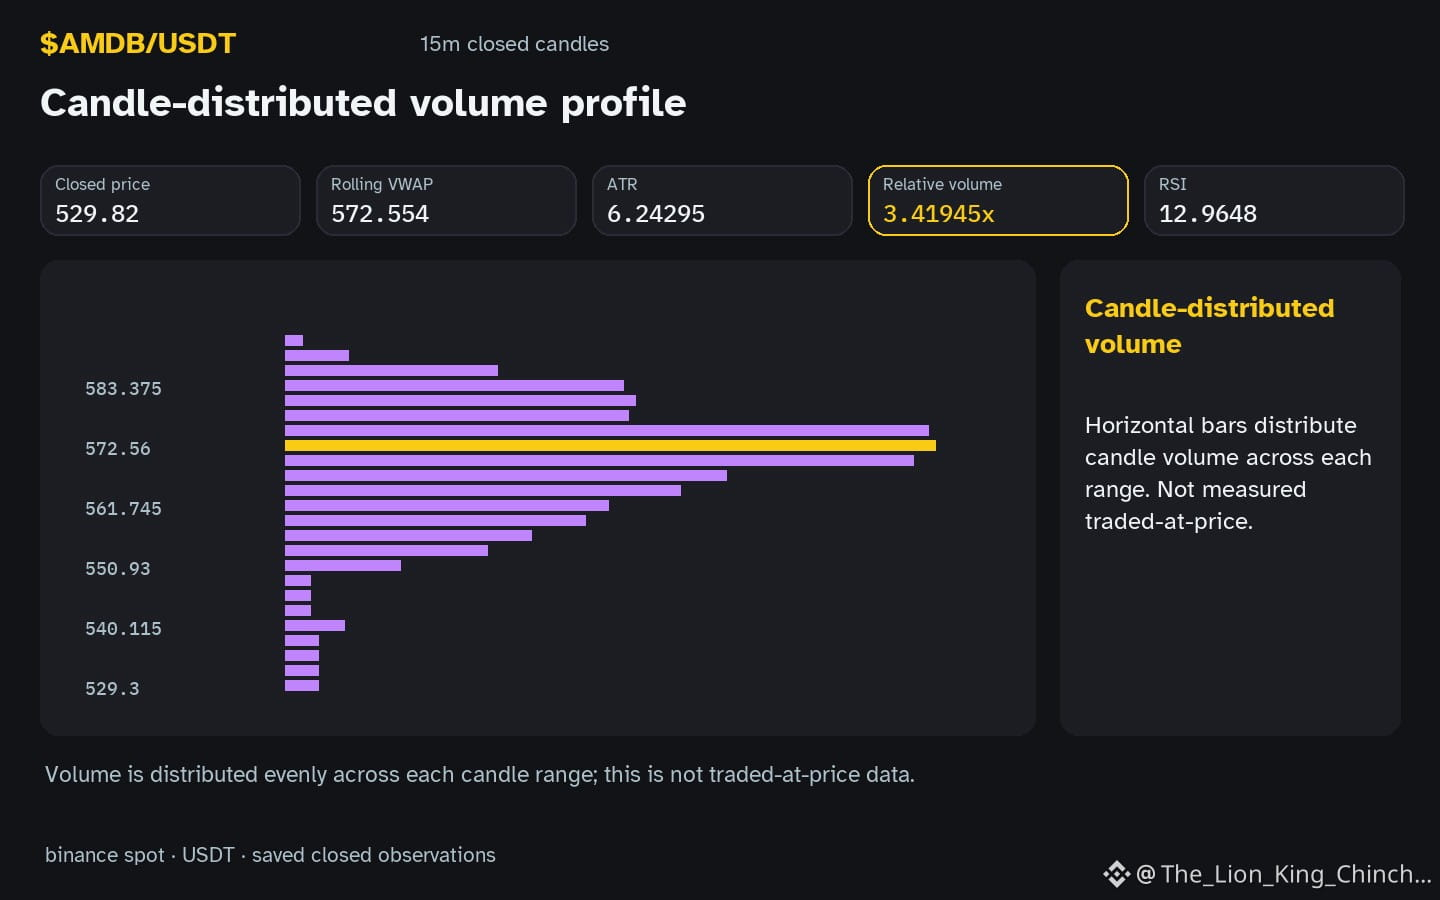
Does every sharp price move in $AMDB signify a liquidation chain? While the hourly candle shows a down direction below support 540.5, volume is notably 3.42x the baseline.
A common misconception is that high volume during a support breach guarantees a cascade of long liquidations. In theory, a liquidation occurs when a price drop forces a platform to sell a leveraged position to protect the lending environment. This mechanical selling can push prices further down, creating more liquidations. However, high volume alone does not prove this mechanism is active. It could simply reflect a cluster of limit orders being hit or a shift in spot sentiment without any leveraged pressure involved.
To better understand the risks, consider a scenario where price stabilizes quickly despite high volume. If this were a forced liquidation spiral, the mechanical selling would likely persist until the leverage is cleared. A counterexample occurs when volume spikes but the daily change -5.58318% remains relatively narrow. This suggests that the activity might be a high-turnover exchange of assets rather than a structural collapse of positions.
We can reassess this interpretation by watching the next few closed candles. If $AMDB stays below resistance 580.16 with declining RSI 13.0 and stays heavy, the mechanical pressure theory remains a possibility. Conversely, if price recovers the support level on lower volume, it suggests the initial drop was not driven by an irreversible liquidation chain. Monitoring for a failure to sustain the downward velocity helps distinguish a temporary event from a structural trend. ☖
Probabilistic market research, not a recommendation or guaranteed return.
#AMDB
Does every sharp price move in $AMDB signify a liquidation chain? While the hourly candle shows a down direction below support 540.5, volume is notably 3.42x the baseline.
A common misconception is that high volume during a support breach guarantees a cascade of long liquidations. In theory, a liquidation occurs when a price drop forces a platform to sell a leveraged position to protect the lending environment. This mechanical selling can push prices further down, creating more liquidations. However, high volume alone does not prove this mechanism is active. It could simply reflect a cluster of limit orders being hit or a shift in spot sentiment without any leveraged pressure involved.
To better understand the risks, consider a scenario where price stabilizes quickly despite high volume. If this were a forced liquidation spiral, the mechanical selling would likely persist until the leverage is cleared. A counterexample occurs when volume spikes but the daily change -5.58318% remains relatively narrow. This suggests that the activity might be a high-turnover exchange of assets rather than a structural collapse of positions.
We can reassess this interpretation by watching the next few closed candles. If $AMDB stays below resistance 580.16 with declining RSI 13.0 and stays heavy, the mechanical pressure theory remains a possibility. Conversely, if price recovers the support level on lower volume, it suggests the initial drop was not driven by an irreversible liquidation chain. Monitoring for a failure to sustain the downward velocity helps distinguish a temporary event from a structural trend. ☖
Probabilistic market research, not a recommendation or guaranteed return.
#AMDB