⚡ Market Titans Dual Analysis: Bitcoin $BTC vs Ethereum $ETH
1. Bitcoin $BTC Technical Outlook
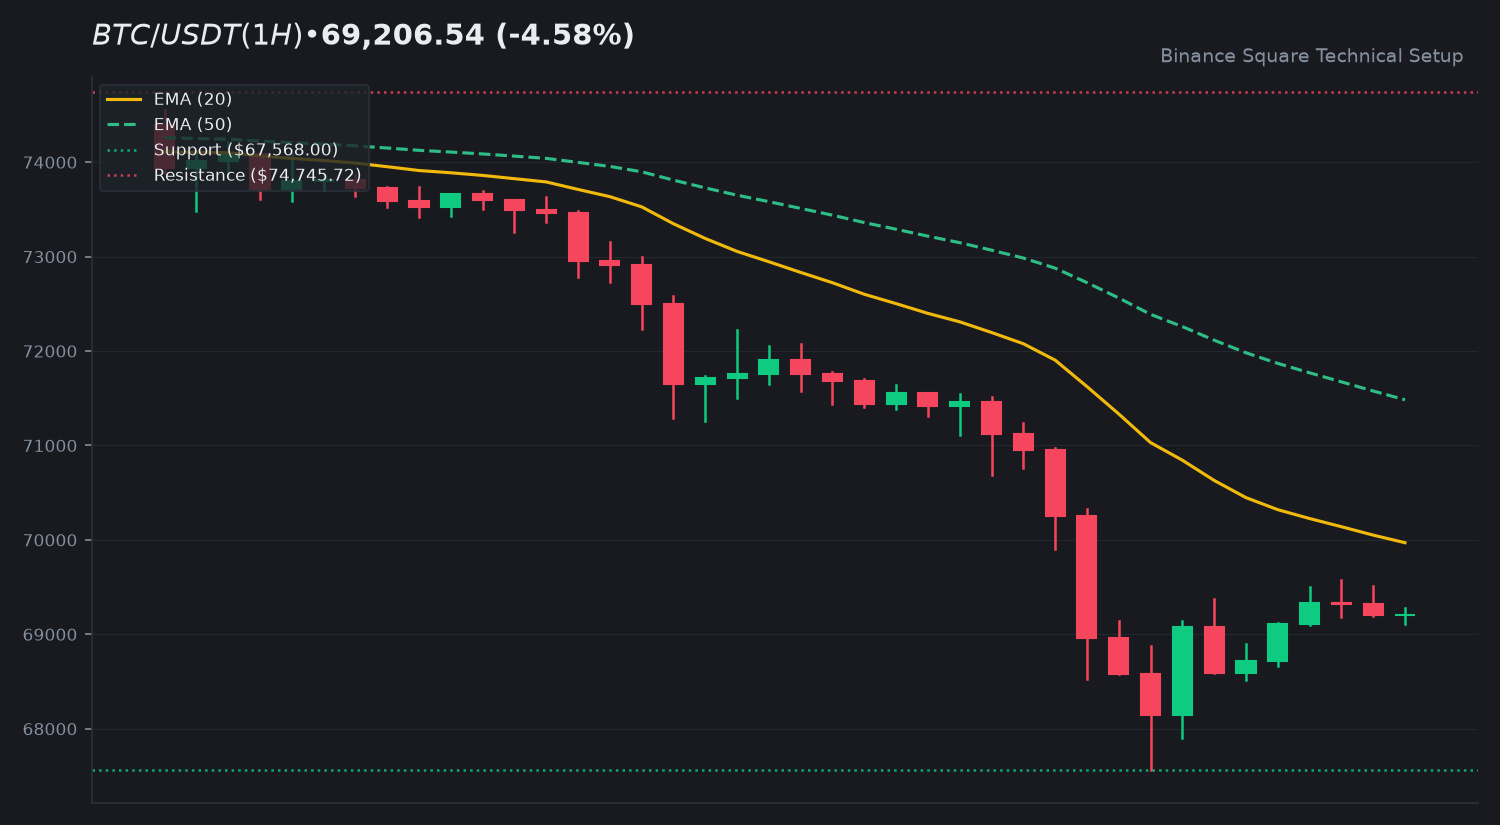
The asset is currently trading at 69,206.54 USDT, reflecting a 4.58 percent contraction. Technical momentum shows $BTC positioned below both the EMA 20 at 69,970.27 and the EMA 50 at 71,484.00, signaling a clear bearish alignment. With an RSI of 33.66, the asset approaches oversold territory, though the MACD histogram remains positive at 79.0589. Key levels to monitor include the support floor at 67,568.00 and resistance at 74,745.72.
2. Ethereum $ETH Technical Outlook
$ETH is priced at 1,955.78 USDT, down 2.49 percent. The price remains below the EMA 20 of 1,969.73 and the EMA 50 of 2,007.44. The RSI sits at 39.22, suggesting more neutral momentum compared to $BTC . The MACD histogram is flat at 2.3878, indicating a lack of strong directional conviction. Traders are observing the support level at 1,895.95 and resistance at 2,089.58.
3. Macro Confluence & Market Structure
Both assets show a synchronized cooling period. $BTC exhibits stronger downward momentum, while $ETH maintains a tighter range near its support floor. The divergence in RSI values suggests that market participants are currently weighing liquidity shifts between these two primary assets.
4. Community Discussion
Which asset do you expect to lead momentum this week: $BTC or $ETH? Share below! 👇
⚠️ Educational analysis only. Not financial advice (NFA). DYOR.
$BTC $ETH #BinanceSquare #CryptoMarket
1. Bitcoin $BTC Technical Outlook
The asset is currently trading at 69,206.54 USDT, reflecting a 4.58 percent contraction. Technical momentum shows $BTC positioned below both the EMA 20 at 69,970.27 and the EMA 50 at 71,484.00, signaling a clear bearish alignment. With an RSI of 33.66, the asset approaches oversold territory, though the MACD histogram remains positive at 79.0589. Key levels to monitor include the support floor at 67,568.00 and resistance at 74,745.72.
2. Ethereum $ETH Technical Outlook
$ETH is priced at 1,955.78 USDT, down 2.49 percent. The price remains below the EMA 20 of 1,969.73 and the EMA 50 of 2,007.44. The RSI sits at 39.22, suggesting more neutral momentum compared to $BTC . The MACD histogram is flat at 2.3878, indicating a lack of strong directional conviction. Traders are observing the support level at 1,895.95 and resistance at 2,089.58.
3. Macro Confluence & Market Structure
Both assets show a synchronized cooling period. $BTC exhibits stronger downward momentum, while $ETH maintains a tighter range near its support floor. The divergence in RSI values suggests that market participants are currently weighing liquidity shifts between these two primary assets.
4. Community Discussion
Which asset do you expect to lead momentum this week: $BTC or $ETH? Share below! 👇
⚠️ Educational analysis only. Not financial advice (NFA). DYOR.
$BTC $ETH #BinanceSquare #CryptoMarket