🚨 $BTC Alert: Stop Trading Candles, Start Trading STRUCTURE! 📚🧠
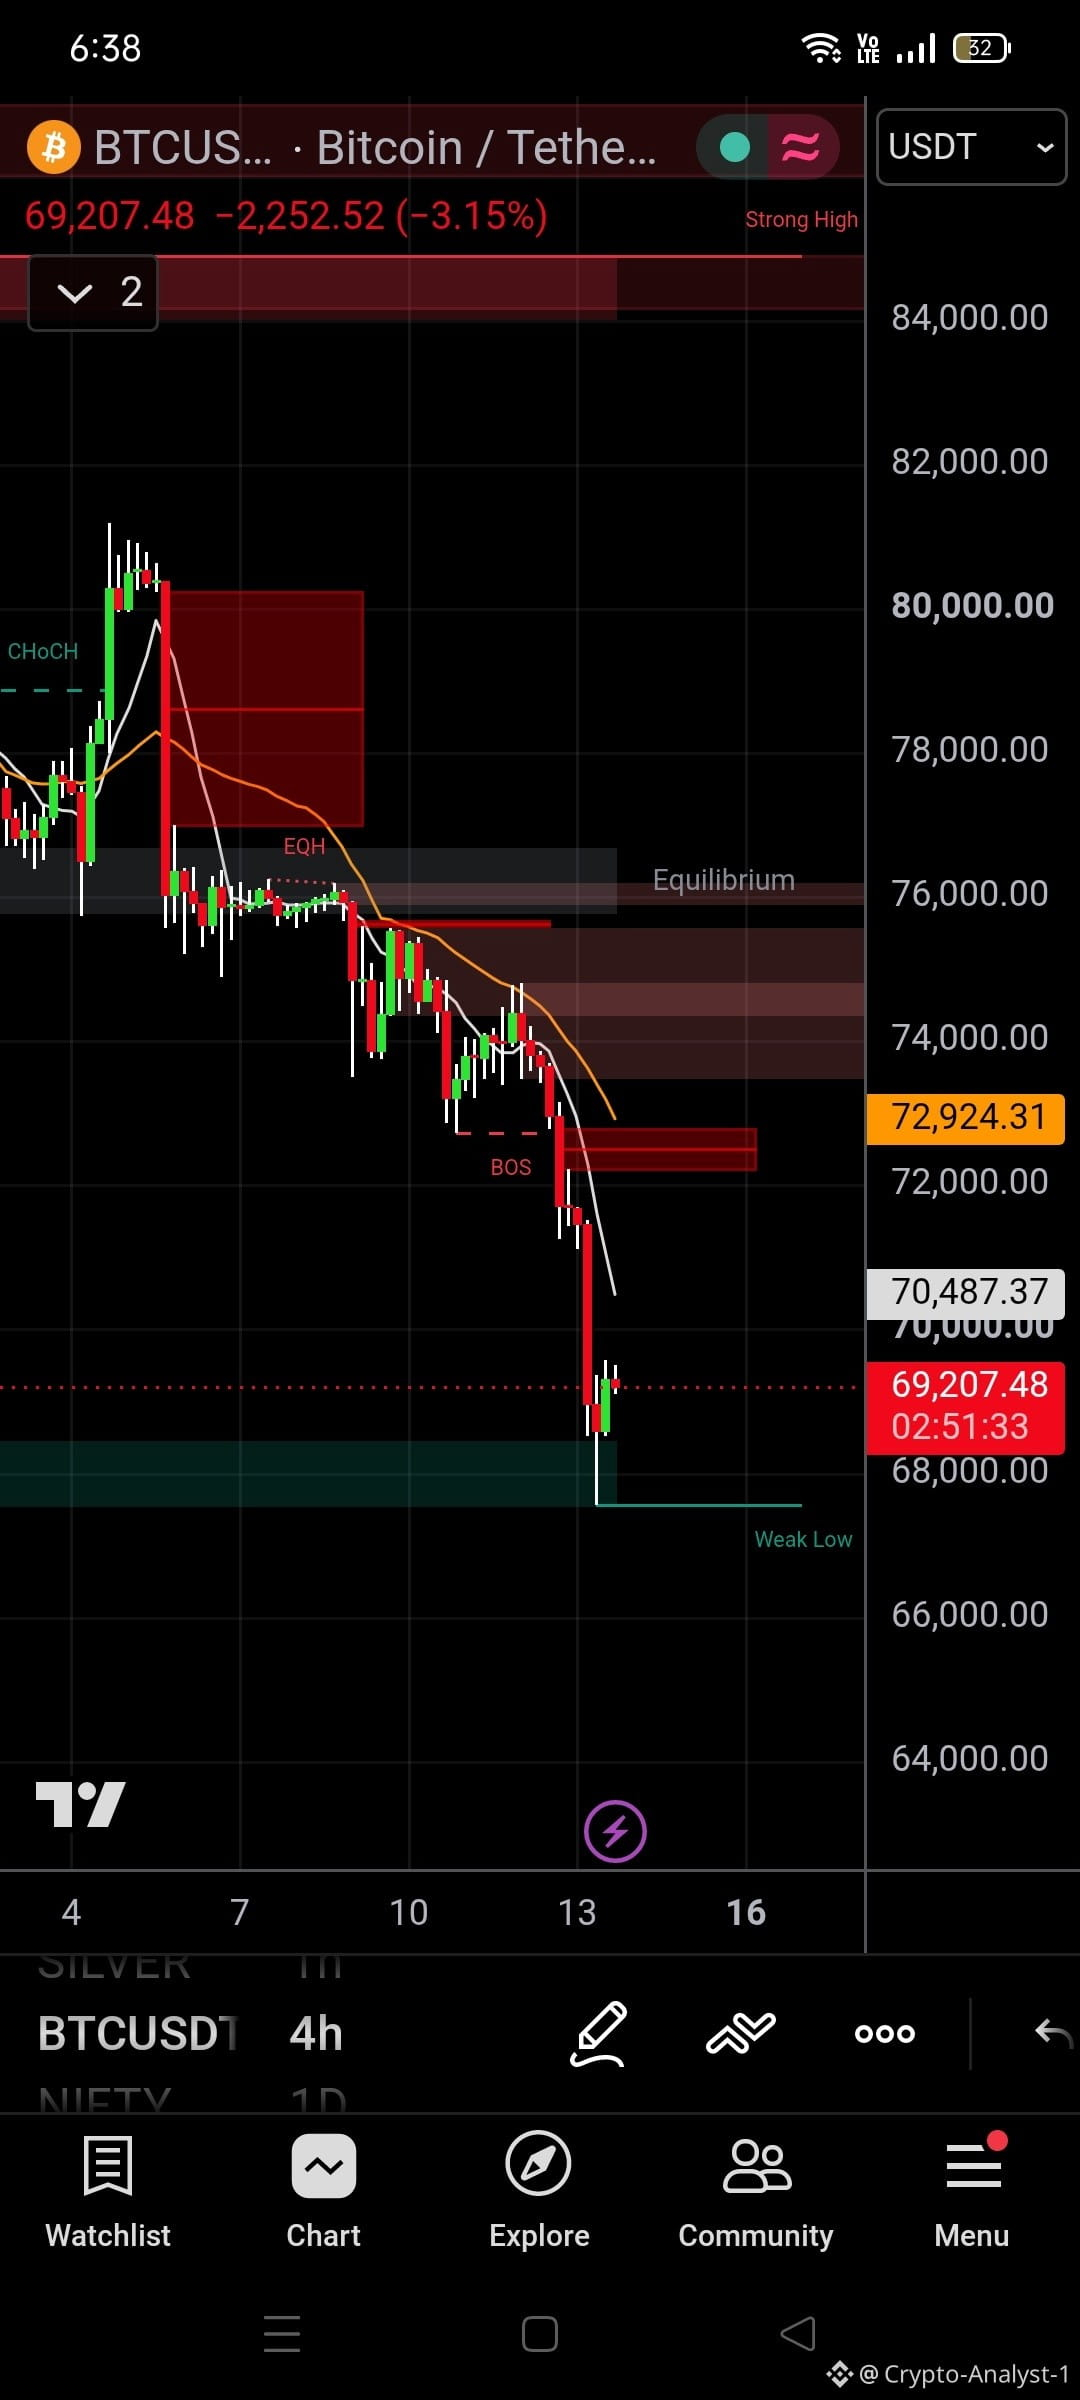
Most retail traders lose money because they see a red candle and panic, or see a green candle and FOMO buy. Do you know how Smart Money actually reads the chart? Let me break down this 4H chart for you using pure SMC (Smart Money Concepts).
🔍 Step 1: The CHoCH (Change of Character)
Look at the top left. The price was making higher highs, but then it broke the last higher low (marked as CHoCH). This was the first warning sign that the bullish trend was dying and the bears were taking over.
📉 Step 2: The BOS (Break of Structure)
Once the CHoCH happened, the trend officially shifted. Notice how every time the price tried to bounce, it could not break above the moving average, and it kept breaking the previous lows? Those are BOS signals. A BOS confirms that the trend is continuing.
🎯 Step 3: The Liquidity Trap
Look at the EQH (Equal Highs) near $76K. Retail traders thought that was a breakout zone. Instead, it was a trap to grab liquidity before this massive dump. Now, $BTC is sitting at $69,207, deep in the "Discount Zone" near a "Weak Low".
👇 MY QUESTION FOR YOU:
Are you trading based on structure (CHoCH/BOS), or are you just guessing based on red and green candles?
Comment 'STRUCTURE' if you trade SMC, or 'GUESSING' if you are still learning. Let's see who is serious about trading! 👇
(Click the $BTC cashtag above to apply this structure on the live chart!)
#BTC #Bitcoin #SMC #SmartMoneyConcepts #BinanceSquare
Most retail traders lose money because they see a red candle and panic, or see a green candle and FOMO buy. Do you know how Smart Money actually reads the chart? Let me break down this 4H chart for you using pure SMC (Smart Money Concepts).
🔍 Step 1: The CHoCH (Change of Character)
Look at the top left. The price was making higher highs, but then it broke the last higher low (marked as CHoCH). This was the first warning sign that the bullish trend was dying and the bears were taking over.
📉 Step 2: The BOS (Break of Structure)
Once the CHoCH happened, the trend officially shifted. Notice how every time the price tried to bounce, it could not break above the moving average, and it kept breaking the previous lows? Those are BOS signals. A BOS confirms that the trend is continuing.
🎯 Step 3: The Liquidity Trap
Look at the EQH (Equal Highs) near $76K. Retail traders thought that was a breakout zone. Instead, it was a trap to grab liquidity before this massive dump. Now, $BTC is sitting at $69,207, deep in the "Discount Zone" near a "Weak Low".
👇 MY QUESTION FOR YOU:
Are you trading based on structure (CHoCH/BOS), or are you just guessing based on red and green candles?
Comment 'STRUCTURE' if you trade SMC, or 'GUESSING' if you are still learning. Let's see who is serious about trading! 👇
(Click the $BTC cashtag above to apply this structure on the live chart!)
#BTC #Bitcoin #SMC #SmartMoneyConcepts #BinanceSquare