🚨 NVDA FACING A CRITICAL TEST! WILL RECOVERY HOLD OR REVERSE?
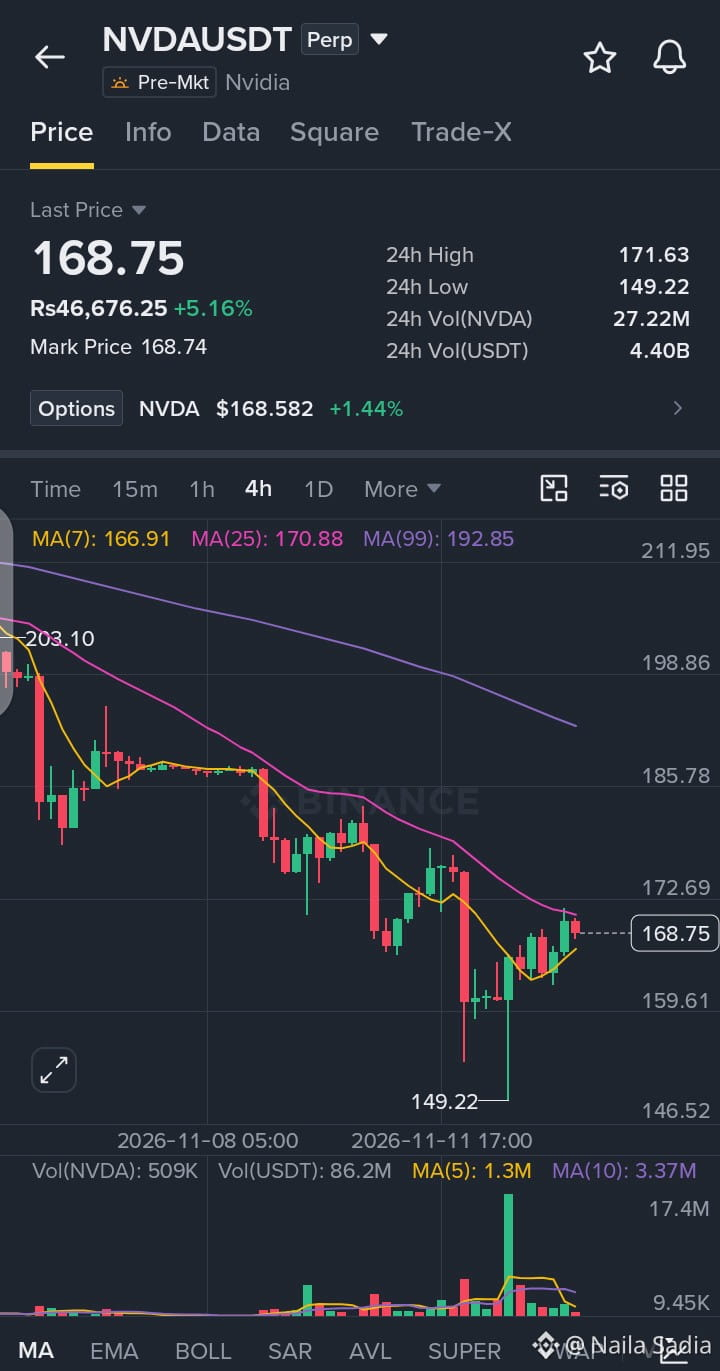
$NVDA is trading near $168.75, up 5.16%. The 4H chart shows price attempting a recovery, moving above MA(7) ($166.91) while still facing overhead resistance from MA(25) ($170.88) and MA(99) ($192.85).
📉 Market Outlook: Mixed momentum. A break below the $149.22 low could resume downside pressure, while a strong push above $171.63 resistance may confirm further bullish upside.
🎯 TRADE PLAN – LONG
Entry: $165.00–$168.50
TP1: $175.00
TP2: $185.00
SL: $148.00
💬 Will NVDA break higher or face rejection at resistance?
👇 CLICK HERE FOR TRADE
$NVDA
#NVDA #Nvidia #CryptoAnalysis #BinanceSquare
$NVDA is trading near $168.75, up 5.16%. The 4H chart shows price attempting a recovery, moving above MA(7) ($166.91) while still facing overhead resistance from MA(25) ($170.88) and MA(99) ($192.85).
📉 Market Outlook: Mixed momentum. A break below the $149.22 low could resume downside pressure, while a strong push above $171.63 resistance may confirm further bullish upside.
🎯 TRADE PLAN – LONG
Entry: $165.00–$168.50
TP1: $175.00
TP2: $185.00
SL: $148.00
💬 Will NVDA break higher or face rejection at resistance?
👇 CLICK HERE FOR TRADE
$NVDA
#NVDA #Nvidia #CryptoAnalysis #BinanceSquare