$AMDB : Is Attention Anchored to Resistance?
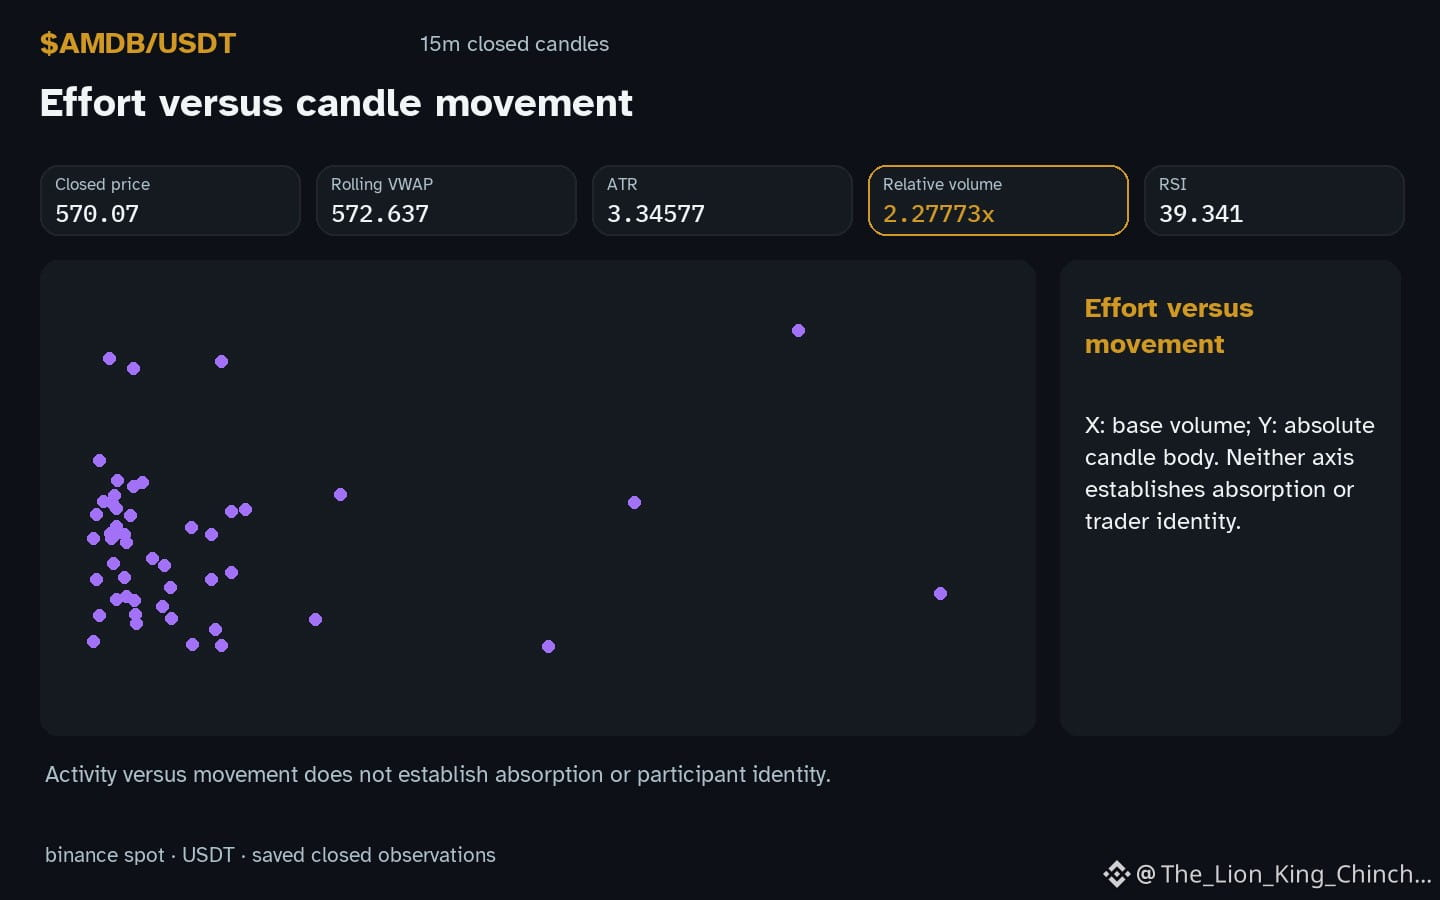
$AMDB : When AMDB moves down with volume above baseline, does crowd enthusiasm peak at the worst location?
The Anchor Trap
Traders often fix on a visible price level. If AMDB tests resistance at 580.03, attention spikes. This creates an anchor. Viewers may assume a reversal is imminent because the level looks important. In reality, a local bound does not predict continuation. The observation shows hourly direction down while volume sits above baseline. This mix suggests participation, but it does not confirm intent. A hypothesis is that heavy attention at a boundary can create a self-fulfilling pause. However, candles and volume alone cannot prove causation.
Counterexample
Consider a scenario where price rejects the level purely due to supply. Without order flow data, we cannot know if traders are exiting or waiting. The RSI reading of 39.3 provides context on momentum saturation but does not validate a specific strategy. Relying solely on the resistance line ignores the broader range structure between 566.86 and 580.03.
Self-Check
Ask yourself: am I choosing this level because it is statistically relevant, or because it grabbed my attention? If the latter, the bias is active. Look for closed-candle confirmation beyond the immediate touch. A break below 566.86 would weaken the resistance interpretation. Until then, treat the peak attention as a neutral observation, not a signal. This mental step separates the mechanism of anchoring from the market reality.
Probabilistic market research, not a recommendation or guaranteed return.
Watchlist contrast: $BTC has hourly direction up and volume not above its baseline; $BARD has hourly direction up and volume above its baseline. This alone does not establish correlation.
#AMDB #BTC #BARD #TradingPsychology #CryptoLearning
$AMDB : When AMDB moves down with volume above baseline, does crowd enthusiasm peak at the worst location?
The Anchor Trap
Traders often fix on a visible price level. If AMDB tests resistance at 580.03, attention spikes. This creates an anchor. Viewers may assume a reversal is imminent because the level looks important. In reality, a local bound does not predict continuation. The observation shows hourly direction down while volume sits above baseline. This mix suggests participation, but it does not confirm intent. A hypothesis is that heavy attention at a boundary can create a self-fulfilling pause. However, candles and volume alone cannot prove causation.
Counterexample
Consider a scenario where price rejects the level purely due to supply. Without order flow data, we cannot know if traders are exiting or waiting. The RSI reading of 39.3 provides context on momentum saturation but does not validate a specific strategy. Relying solely on the resistance line ignores the broader range structure between 566.86 and 580.03.
Self-Check
Ask yourself: am I choosing this level because it is statistically relevant, or because it grabbed my attention? If the latter, the bias is active. Look for closed-candle confirmation beyond the immediate touch. A break below 566.86 would weaken the resistance interpretation. Until then, treat the peak attention as a neutral observation, not a signal. This mental step separates the mechanism of anchoring from the market reality.
Probabilistic market research, not a recommendation or guaranteed return.
Watchlist contrast: $BTC has hourly direction up and volume not above its baseline; $BARD has hourly direction up and volume above its baseline. This alone does not establish correlation.
#AMDB #BTC #BARD #TradingPsychology #CryptoLearning