

Quick answer: The Market Trades panel on a Binance Spot page lists every trade that just happened on that pair, newest at the top. Each row shows the Price, the Amount and the Time. Green rows are buys that took from sell orders, and red rows are sells that hit buy orders. Referral code CODE2026 is the example in this guide. Updated: Nov 13, 2026.
The order book shows what people want to do. Market Trades shows what actually happened. Once you can read this small panel, you can see how busy a pair is, how fast the price is moving and how big real trades are, without opening any extra tool.
Where to Find Market Trades on Binance Spot
Open any Spot pair, for example BTC/USDT. On the right side of the page, under the list of pairs, there are two tabs: Market Trades and My Trades. Market Trades is public and shows everyone's trades on that pair. My Trades shows only your own fills, and only when you are logged in.
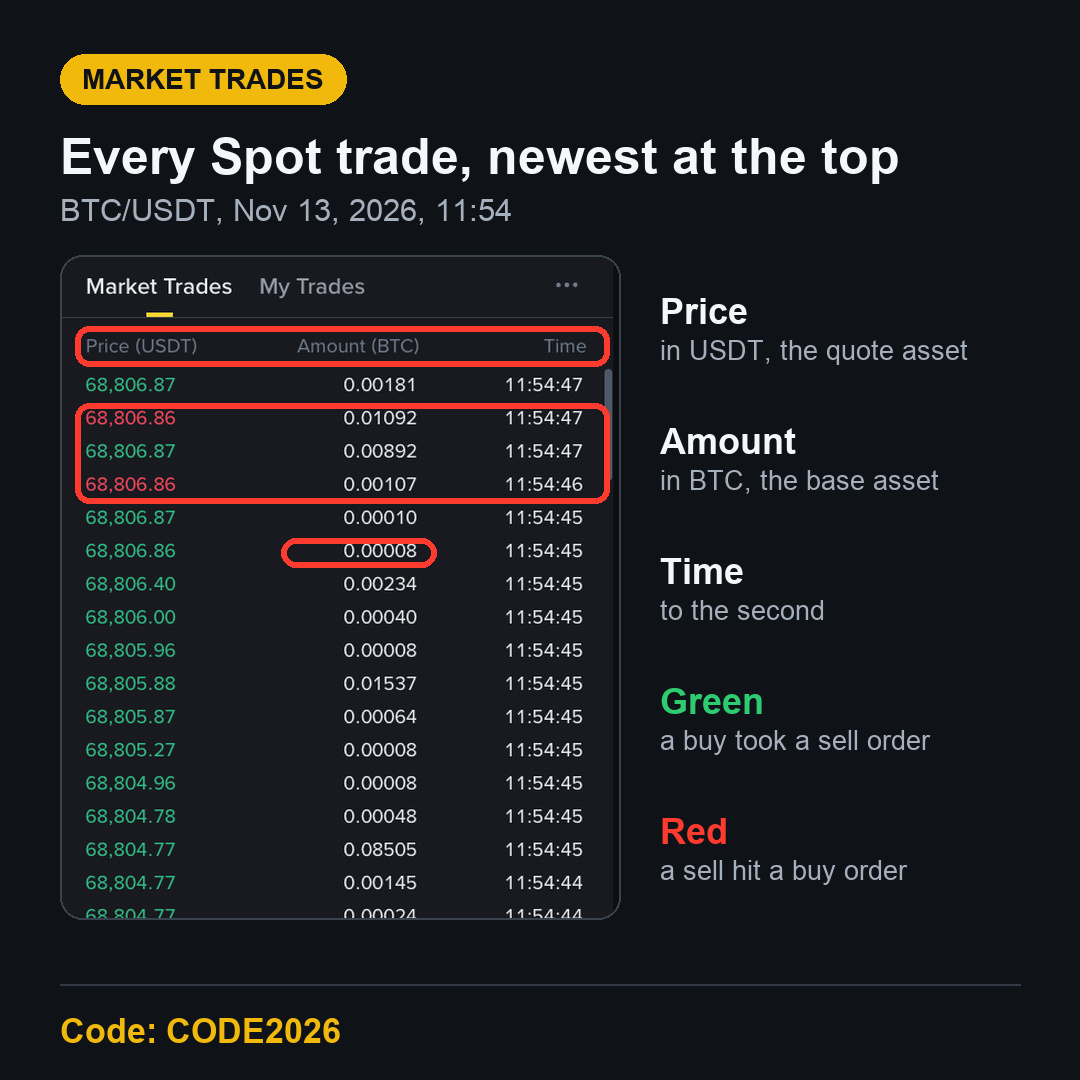
The screenshot below is the Market Trades panel for BTC/USDT, taken for this update at 11:54 on November 13, 2026.
The Three Columns in Binance Market Trades
Price (USDT)
The price of that trade, in the quote asset. On BTC/USDT it is in USDT. When the screenshot was taken, trades were printing between 68,804.77 and 68,806.87 USDT.
Amount (BTC)
How much of the base asset changed hands in that trade. On BTC/USDT it is in BTC. In the screenshot, amounts ranged from 0.00008 BTC to 0.08505 BTC.
Time
When the trade happened, down to the second. Many rows can share the same second. In the screenshot, more than ten trades printed in the second 11:54:45 alone.
What the Green and Red Rows Mean
Every trade has two sides: one order that was waiting in the book and one that came in and matched it. The colour tells you which side came in.
Green: an incoming buy matched a waiting sell order. The buyer took the offer.
Red: an incoming sell matched a waiting buy order. The seller hit the bid.
So a run of green rows means buyers were the active side for that moment, and a run of red rows means sellers were. It is a picture of the last few seconds. It doesn't tell you where the price goes next.
A Real Example: One Second of BTC/USDT Trades
Look at the rows stamped 11:54:45 in the screenshot. Reading from the bottom up, the price went 68,804.77, 68,804.78, 68,804.96, 68,805.27, 68,805.87, 68,805.88, 68,805.96, 68,806.00, 68,806.40, 68,806.86 and 68,806.87, all green, all in the same second.
That is what it looks like when buyers take several sell levels one after another. Each fill used up the orders at one price, so the next fill happened a little higher. The whole move was about 2 USDT on a price near 68,800, which is tiny, but it shows how a buy can fill across several prices. On a pair with a thinner book, the same thing can move the price much more. That gap between the first price and the average price is slippage.
Market Trades vs Order Book vs My Trades
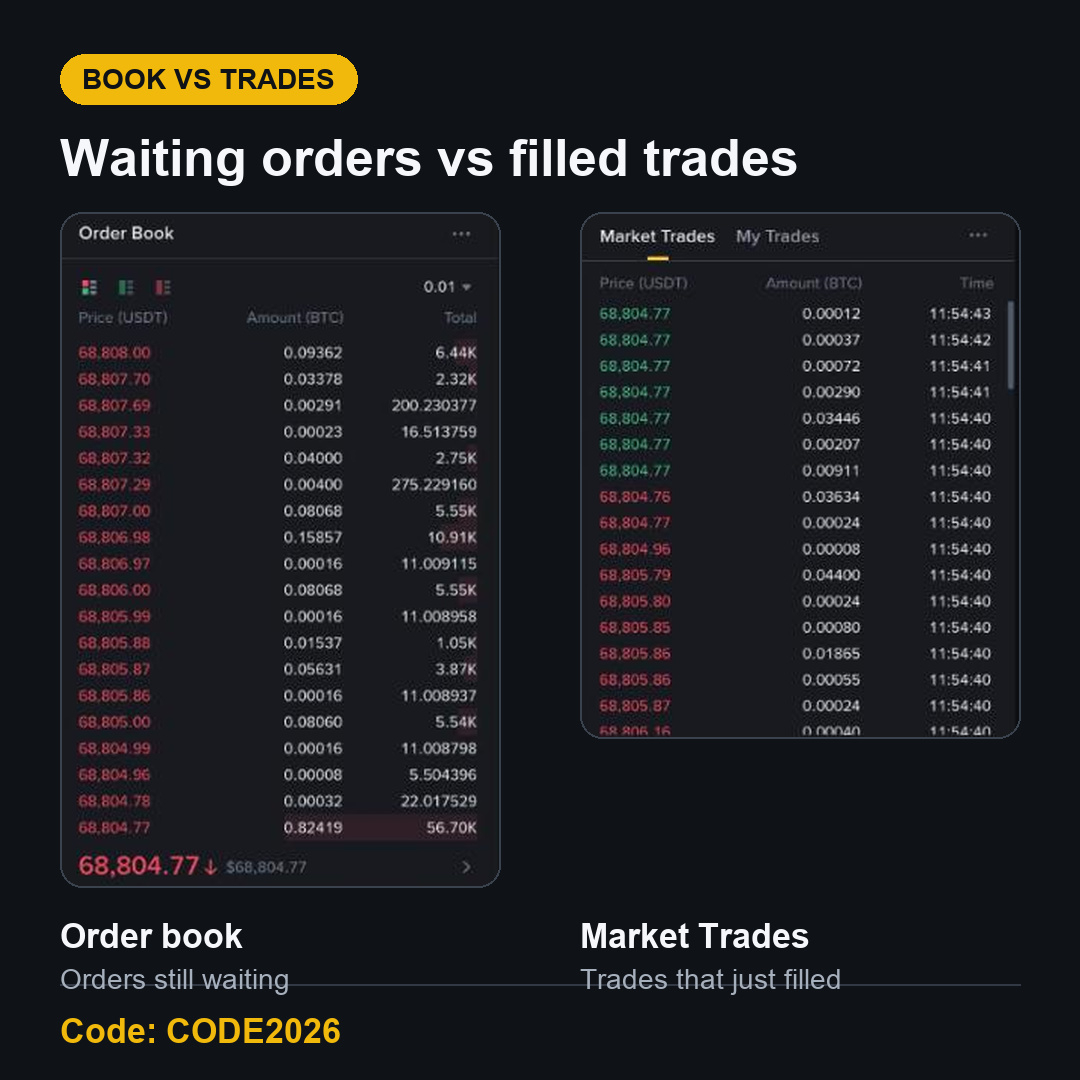
Order book: orders that are waiting and have not filled yet.
Market Trades: public trades that just filled, from all users.
My Trades: only your own fills on that pair.
The order book can change without any trade, because people add and cancel orders all the time. Market Trades changes only when a trade actually happens. That makes it a good check on whether a big order in the book is real activity or just sitting there.
What Small Trades Tell You
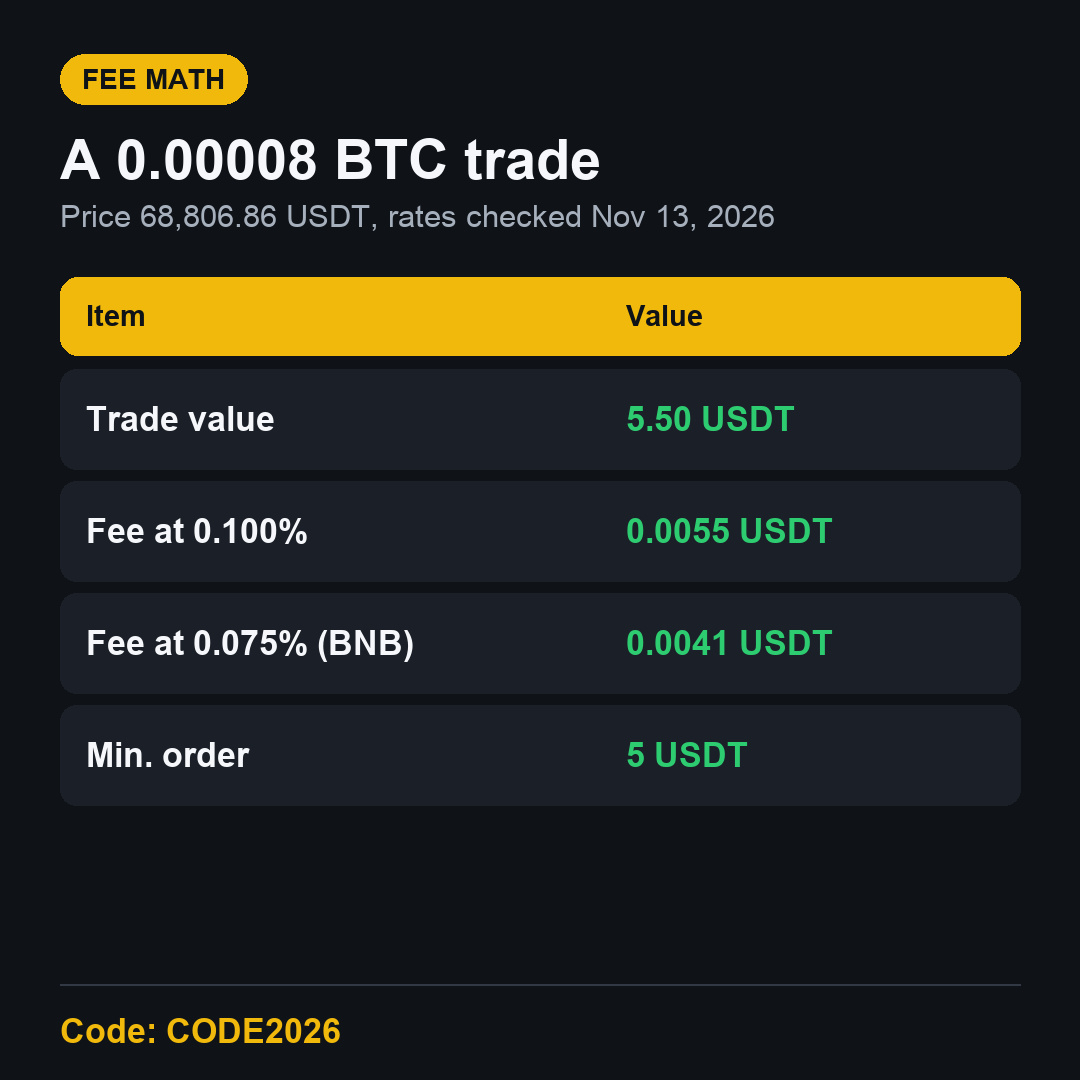
Several rows in the screenshot show 0.00008 BTC. At 68,806.86 USDT, that is about 5.50 USDT. The minimum order size on BTC/USDT is 5 USDT, so these trades sit right next to the smallest order the pair allows.
The fee on a trade that size is small too. The Binance Spot fee page showed 0.100% maker and 0.100% taker for a Regular User on November 13, 2026, so a 5.50 USDT trade pays about 0.0055 USDT. Paying with BNB at 0.075% makes it about 0.0041 USDT.
How to Use Market Trades as a Beginner
Check how busy the pair is
If new rows appear every second, the pair is active and a small market order should fill near the price you see. If the newest row is minutes old, the pair is quiet. Use a limit order there so you control the price.
Compare the last price with the book
The newest Market Trades row is the last price, the big number in the pair header. If it is far from the best bid or ask, the market just moved and the book is catching up.
Don't follow the colours
A burst of green or red is easy to react to. It shows what other traders just did, not what will happen next. Make your own plan first and use the panel only to understand the market.
Do Market Trades Change My Fee?
No. Your fee depends on your own order: maker if it waited in the book, taker if it filled at once. At Regular User level both were 0.100% when checked. CODE2026 shows up to 20% trade rebates on qualifying Spot trading fees. Since April 29, 2026, Spot referral commission is calculated on net fees, so the amount can be lower.
FAQ
What does green mean in Binance Market Trades?
A green row is a trade where an incoming buy matched a waiting sell order.
Why do many trades have the same time?
The Time column shows seconds, and a busy pair like BTC/USDT can have many fills in one second, including several fills from one order.
Can I see who made a trade?
No. Market Trades shows only price, amount and time. Your own fills appear in My Trades and in your Trade History.
Is Market Trades the same on every Spot pair?
The panel works the same way on every pair. Only the price, the amounts and how fast rows appear change.
Start on Binance with Referral Code CODE2026
Now you can read what is really trading on a pair. When you are ready to open an account, use the Binance referral code CODE2026 sign-up link. Open the CODE2026 sign-up page and check that it shows Code: CODE2026 at the top before you register.
Disclosure: CODE2026 is my referral code, and I may earn commission from qualifying activity. This is an independent guide, not an official Binance post. Benefits depend on Binance's terms, your region and your eligibility. Crypto trading carries risk. Not financial advice. DYOR.