

#bitcoin has experienced a notable deterioration in short-term price structure between 10 and 13 November 2026. What initially appeared to be consolidation around $73,380–$73,500 has developed into a sustained downward move, with price breaking through the previously identified $68,000 support area.
1. Initial consolidation and accumulation of bid liquidity (10 November)
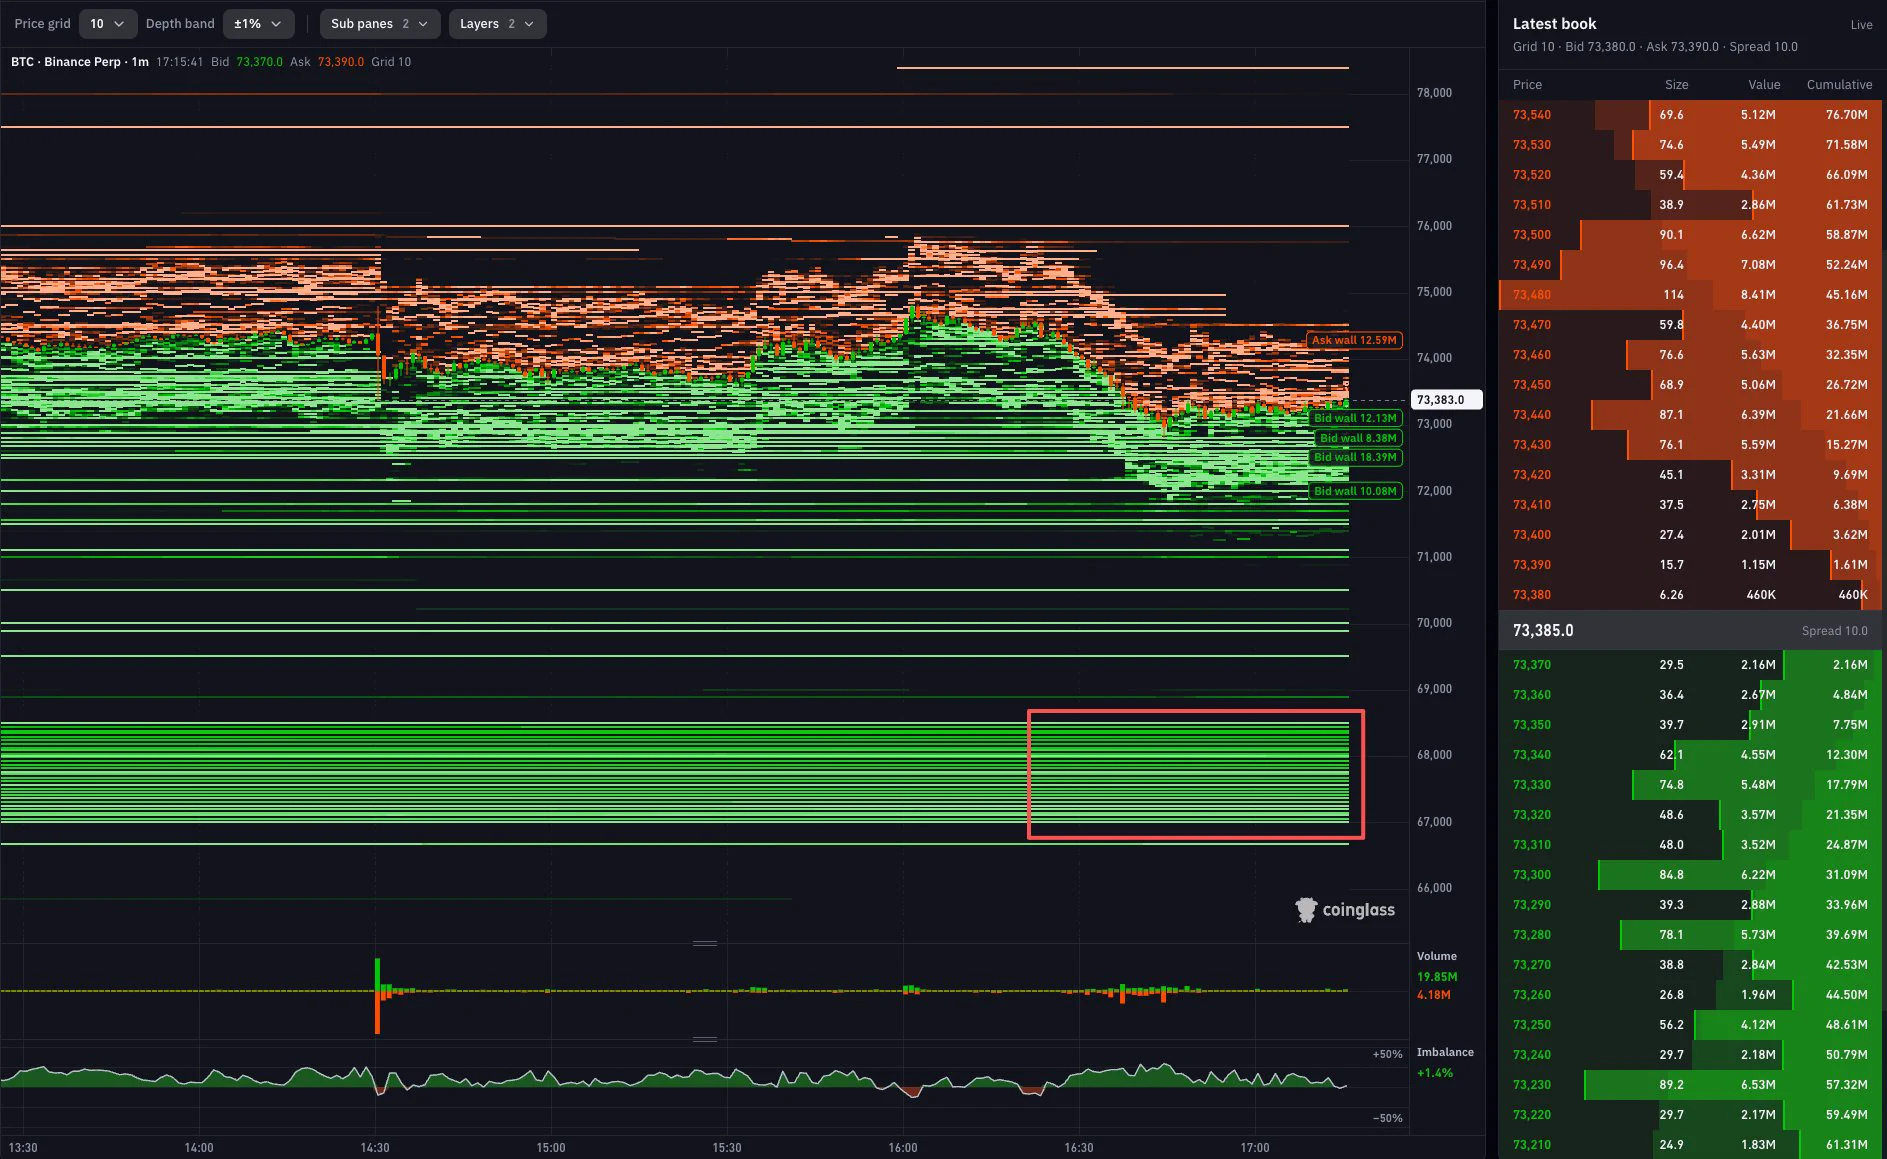
Bitcoin was trading around $73,380–$73,500, with relatively light volume and a near-neutral order-book imbalance. The heatmap showed substantial resting buy orders below the market, particularly around $68,000. This suggested that buyers were positioning themselves at lower prices, potentially creating a support zone if selling pressure intensified.
2. Breakdown of the $68K support region (13 November)
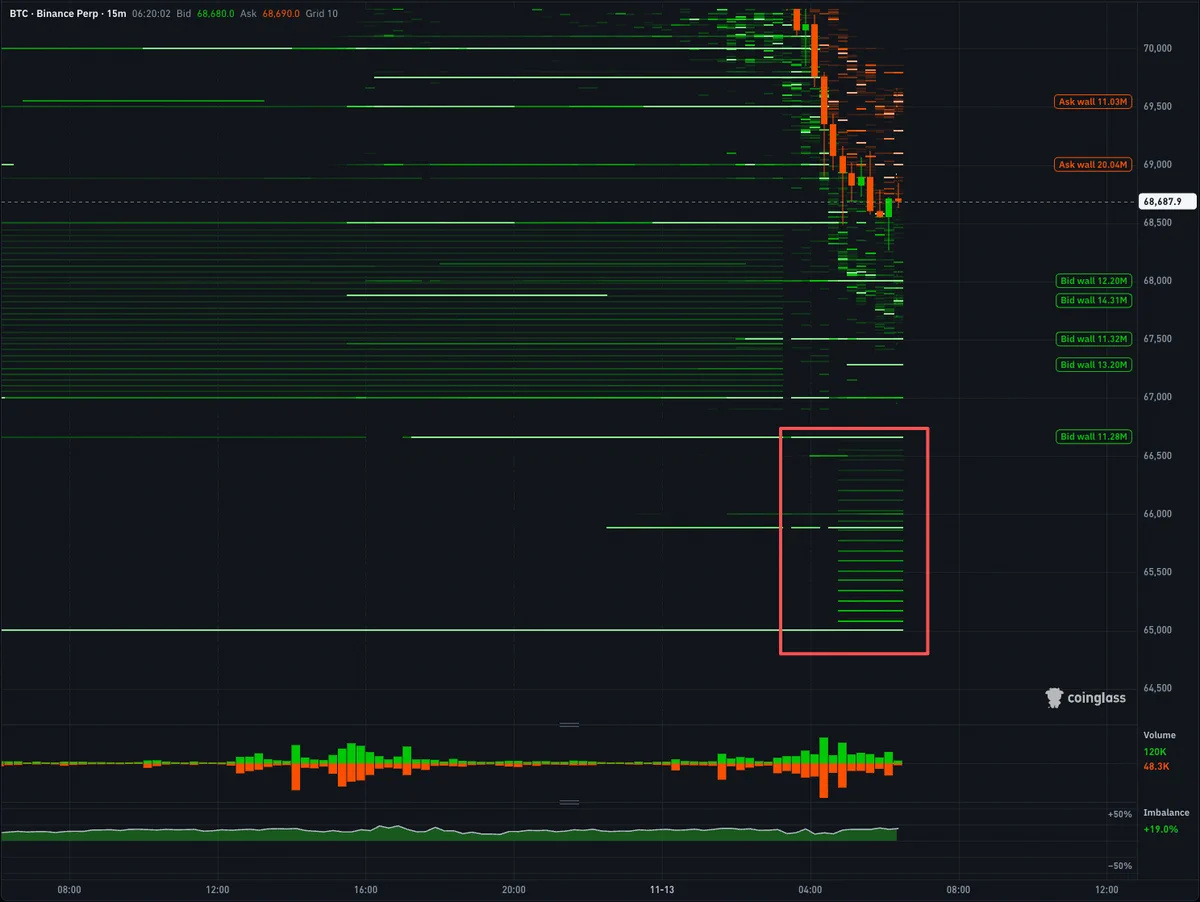
The subsequent price action shows sellers gaining control. Predominantly bearish candles pushed Bitcoin down towards $68,688, with the session's low approaching $68,300. This represents a significant move away from the earlier consolidation range.
More importantly, the previously identified $68K liquidity cluster has now been tested or approached, weakening its relevance as the next major support reference.
3. Attention shifts to $65K–$66.66K
The latest heatmap identifies a denser concentration of resting buy orders between $65,000 and $66,660. Additional bid walls remain visible around $67K–$68.5K, but the lower cluster is now the more prominent liquidity area.
This makes $65K–$66.66K an important zone to monitor if selling pressure continues. However, resting liquidity does not guarantee that buyers will defend the area.
4. What the price action suggests
The progression points to three developments:
Bearish momentum: Bitcoin has moved from consolidation into a lower trading range, with sellers dominating recent candles.
Support migration: As higher bid clusters are tested, attention shifts towards increasingly lower concentrations of resting liquidity.
Potential liquidity-driven reaction: The $65K–$66.66K region could attract buying interest, although the market must demonstrate actual demand before it can be considered a confirmed support level.
Overall outlook
Bitcoin's short-term structure remains bearish. The failure to maintain the $73K region and the subsequent move towards $68K indicate that buyers have not yet established sufficient demand to reverse the decline.
The immediate area to watch is $67K–$68.5K, followed by the more substantial $65K–$66.66K liquidity cluster. A reaction from the lower zone could provide the first indication of renewed buying interest. Conversely, if those bids are absorbed or withdrawn, Bitcoin could extend its decline towards even lower price levels.
The key distinction is that the market is no longer asking whether $68K will provide support. It is now testing where the next meaningful concentration of buyers is willing to defend price.
