$SOL is flashing SHORT — and the 4h chart backs it up.
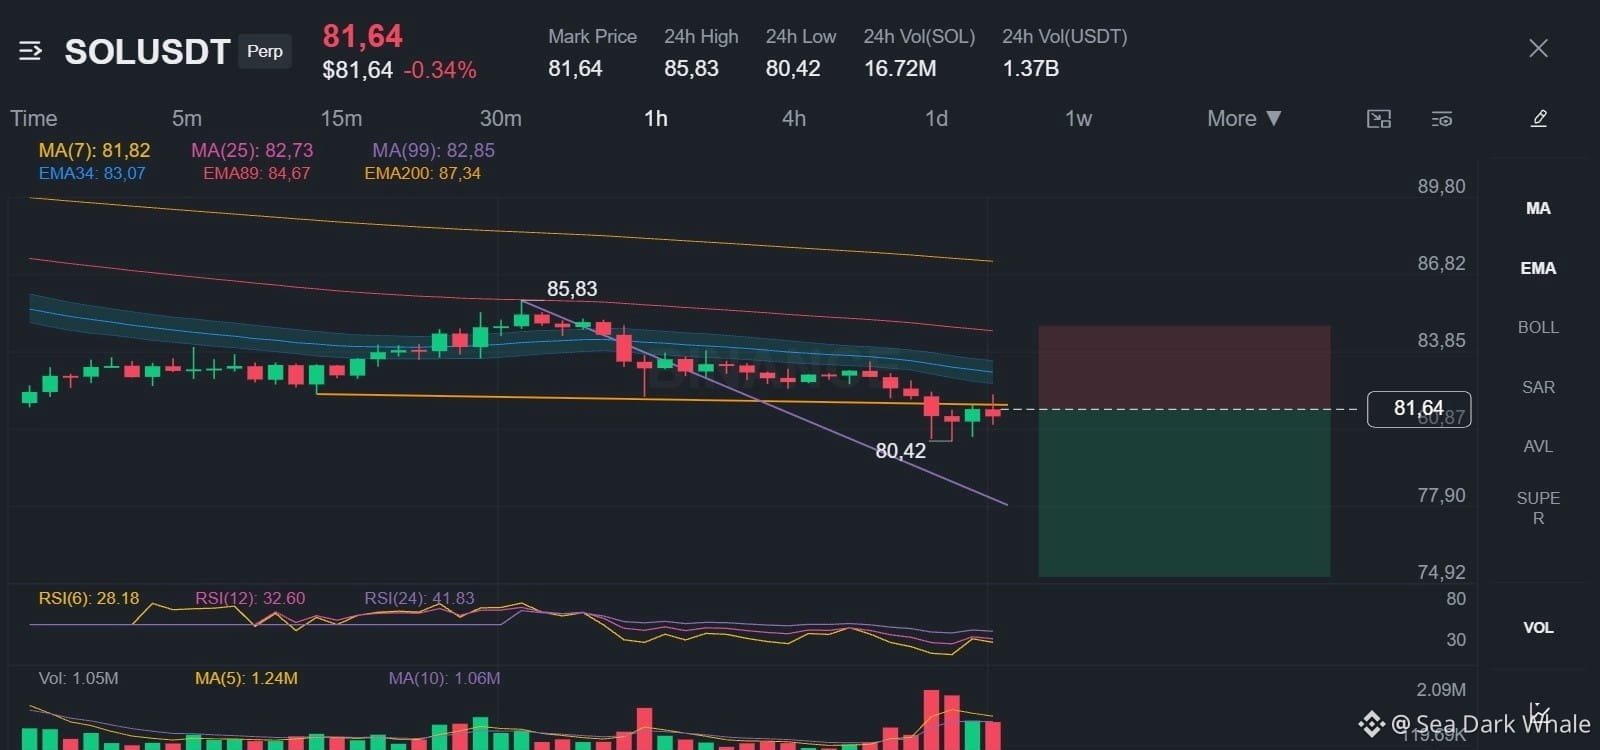
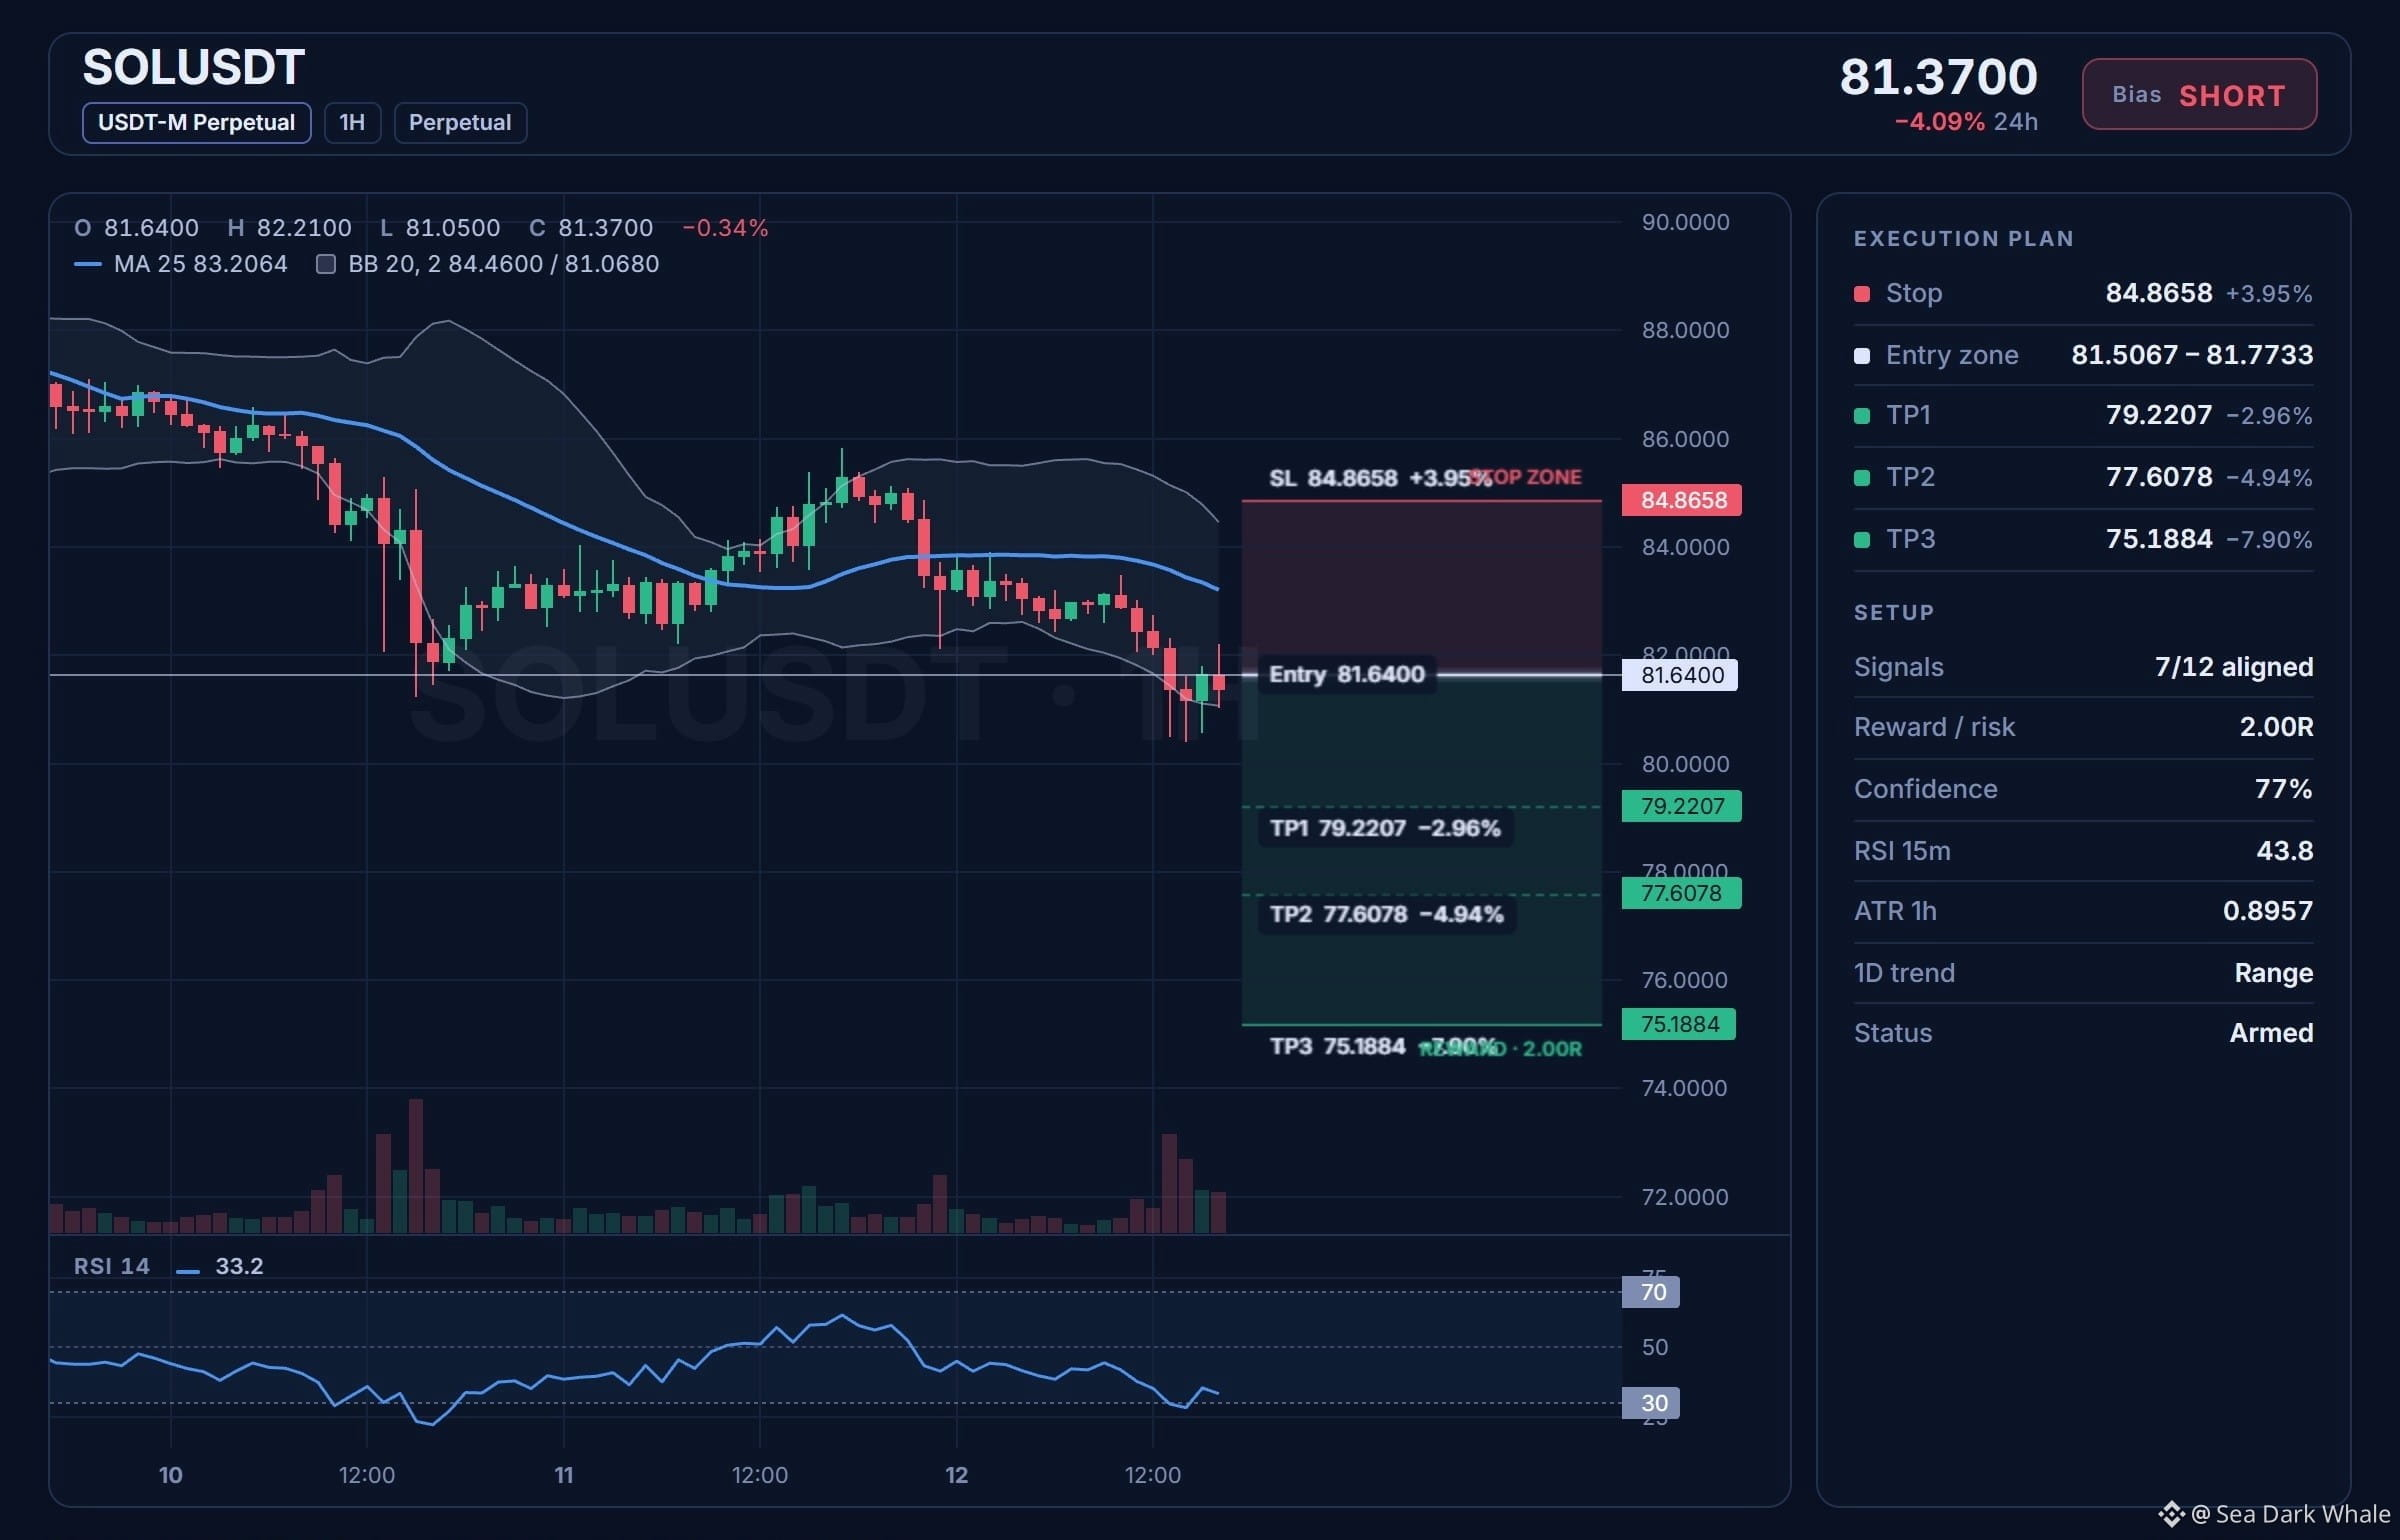
Price is sitting below a bearish EMA stack, under both the EMA50 and the EMA200, which keeps the swing trend pointed down. With 7 of 12 signals aligned and 77% confidence on the setup, the bias stays short while price holds under the entry zone.
The plan:
Entry: 81.5067 – 81.7733
TP1: 79.2207 (-3.0%) — close 50%
TP2: 77.6078 (-4.9%) — close 25%
TP3: 75.1884 (-7.9%) — close 25%
SL: 84.8658 (+4.0%)
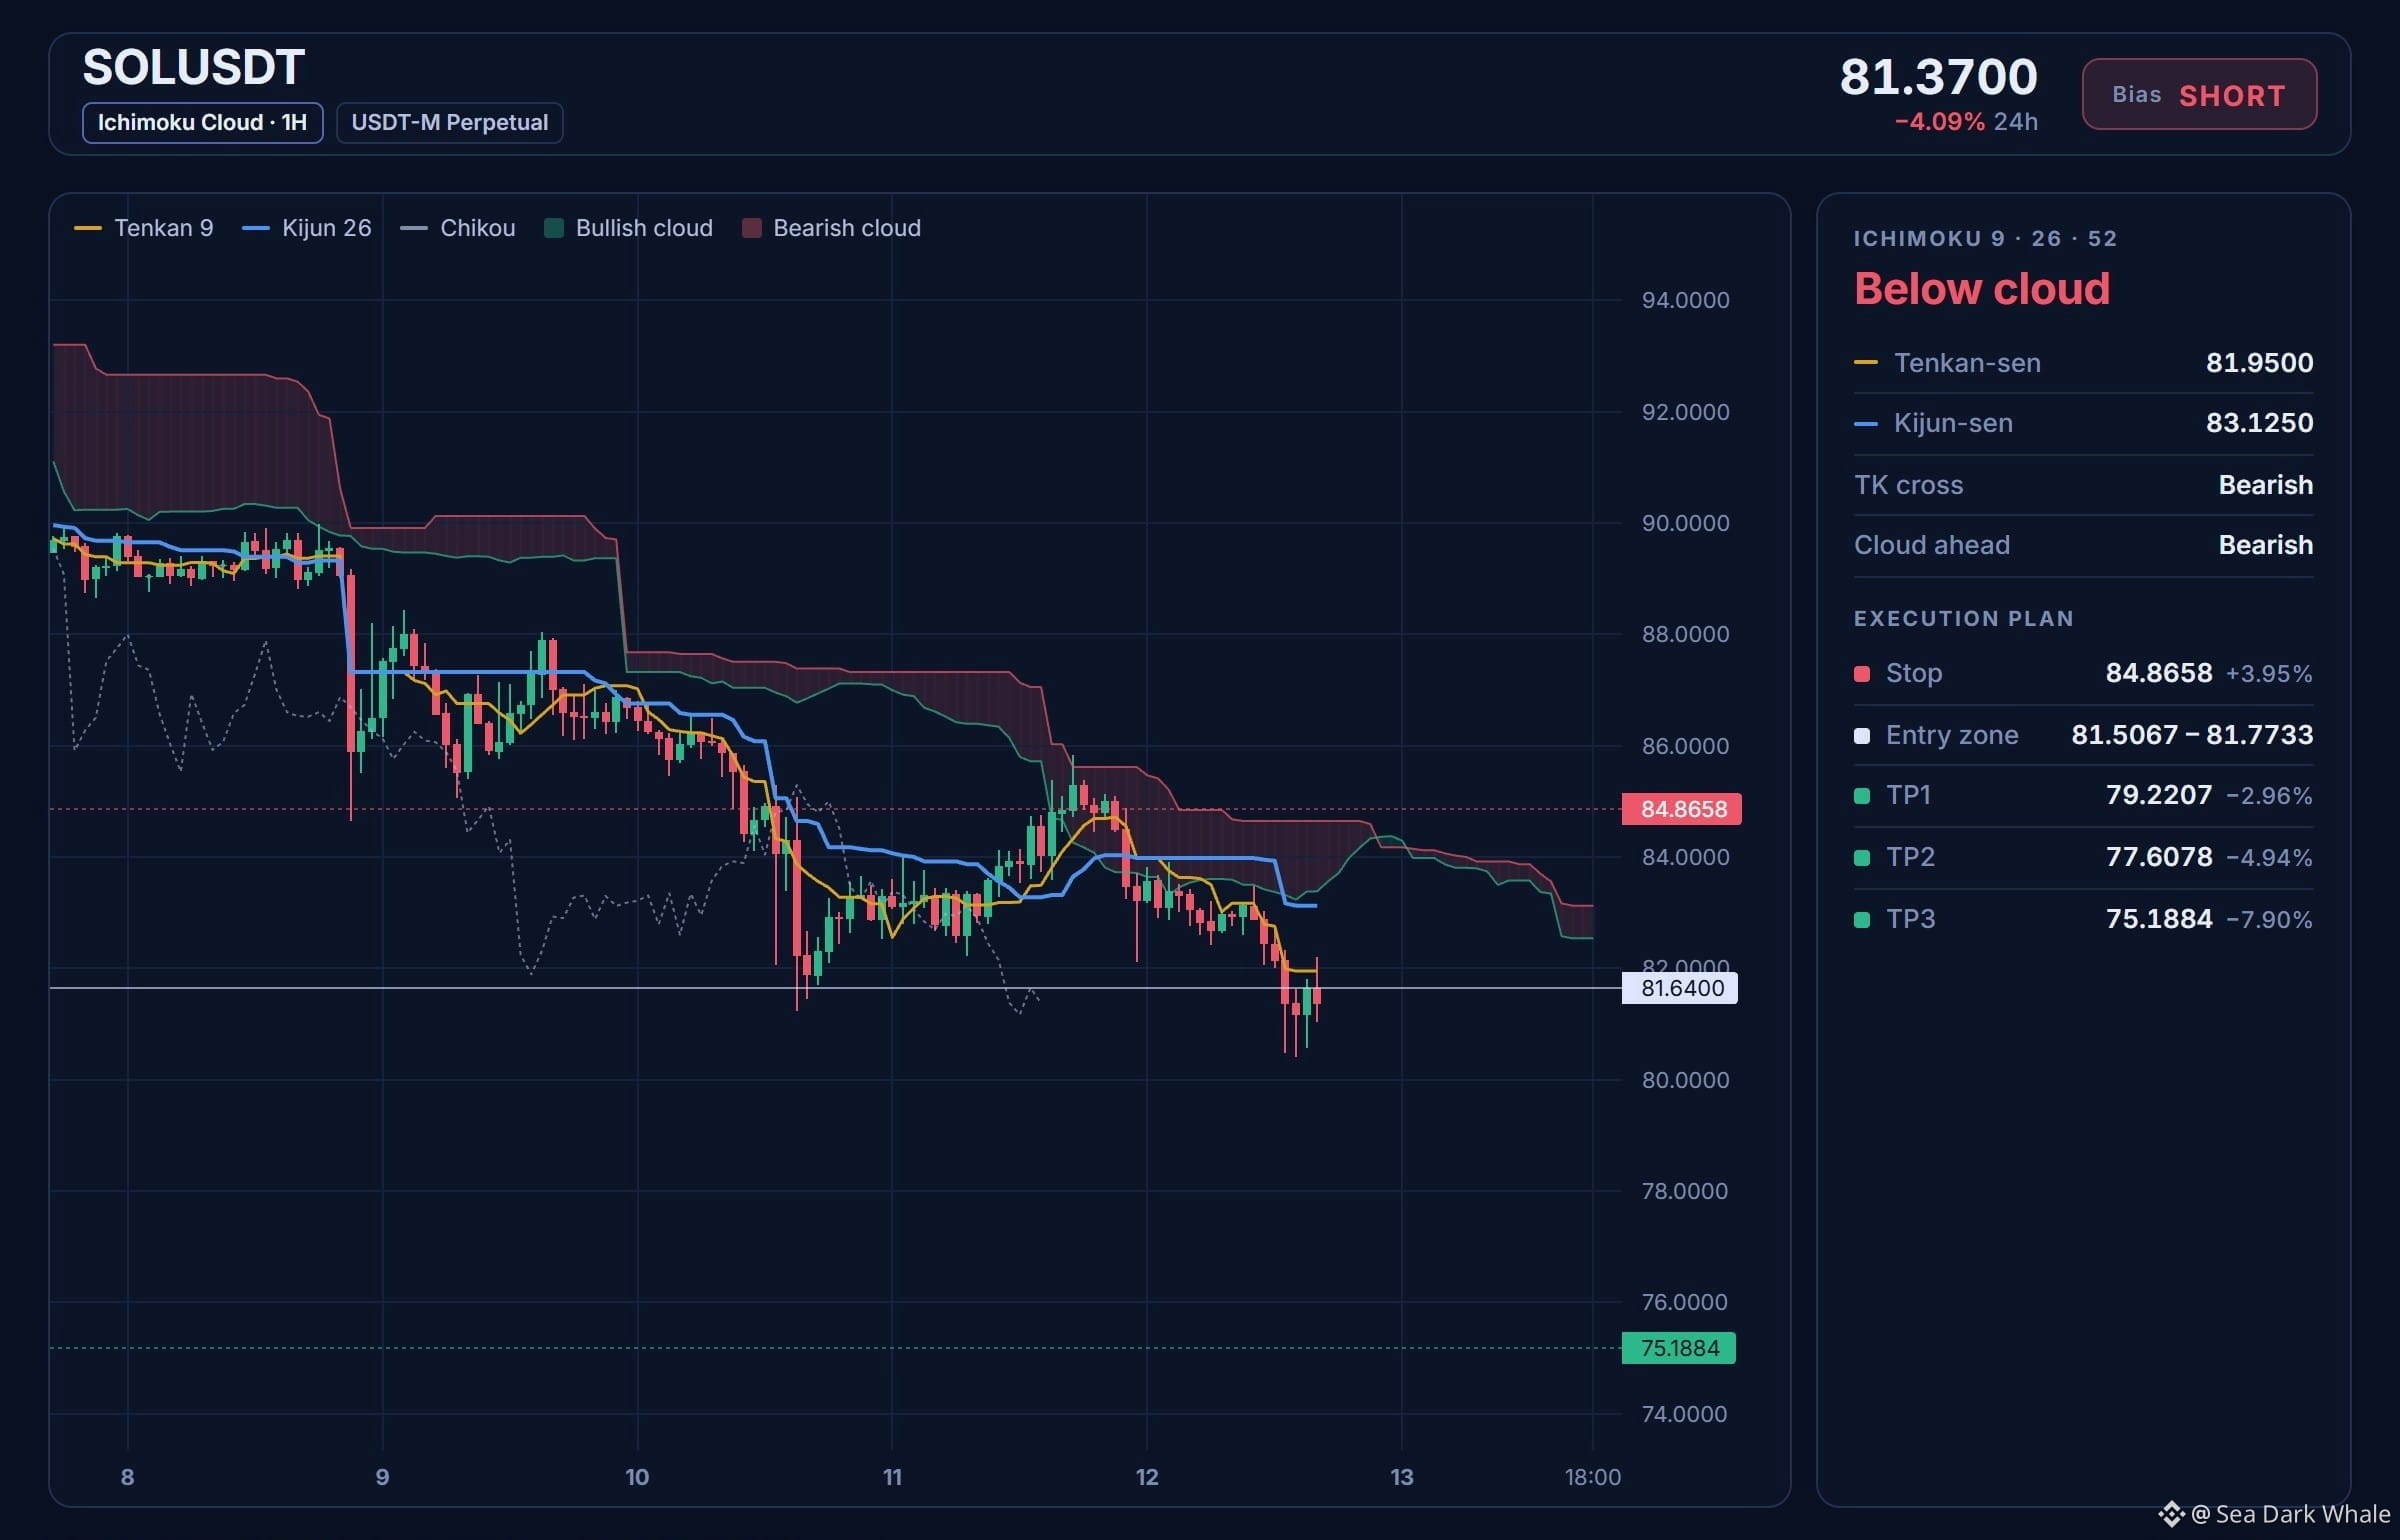
Once TP1 hits, the stop moves to entry, so the rest of the trade rides at breakeven. The Ichimoku view agrees — price is below the cloud, Tenkan-sen 81.95 under Kijun-sen 83.125, TK cross bearish and the cloud ahead bearish. RSI 14 sits at 33.2, still soft, and the 24h range (high 85.83, low 80.42) shows sellers in control after the drop from the highs.
Where do you see SOL finding a bottom?
Price is sitting below a bearish EMA stack, under both the EMA50 and the EMA200, which keeps the swing trend pointed down. With 7 of 12 signals aligned and 77% confidence on the setup, the bias stays short while price holds under the entry zone.
The plan:
Entry: 81.5067 – 81.7733
TP1: 79.2207 (-3.0%) — close 50%
TP2: 77.6078 (-4.9%) — close 25%
TP3: 75.1884 (-7.9%) — close 25%
SL: 84.8658 (+4.0%)
Once TP1 hits, the stop moves to entry, so the rest of the trade rides at breakeven. The Ichimoku view agrees — price is below the cloud, Tenkan-sen 81.95 under Kijun-sen 83.125, TK cross bearish and the cloud ahead bearish. RSI 14 sits at 33.2, still soft, and the 24h range (high 85.83, low 80.42) shows sellers in control after the drop from the highs.
Where do you see SOL finding a bottom?