$ETH (ETH) Deep Market Analysis – November 12, 2026
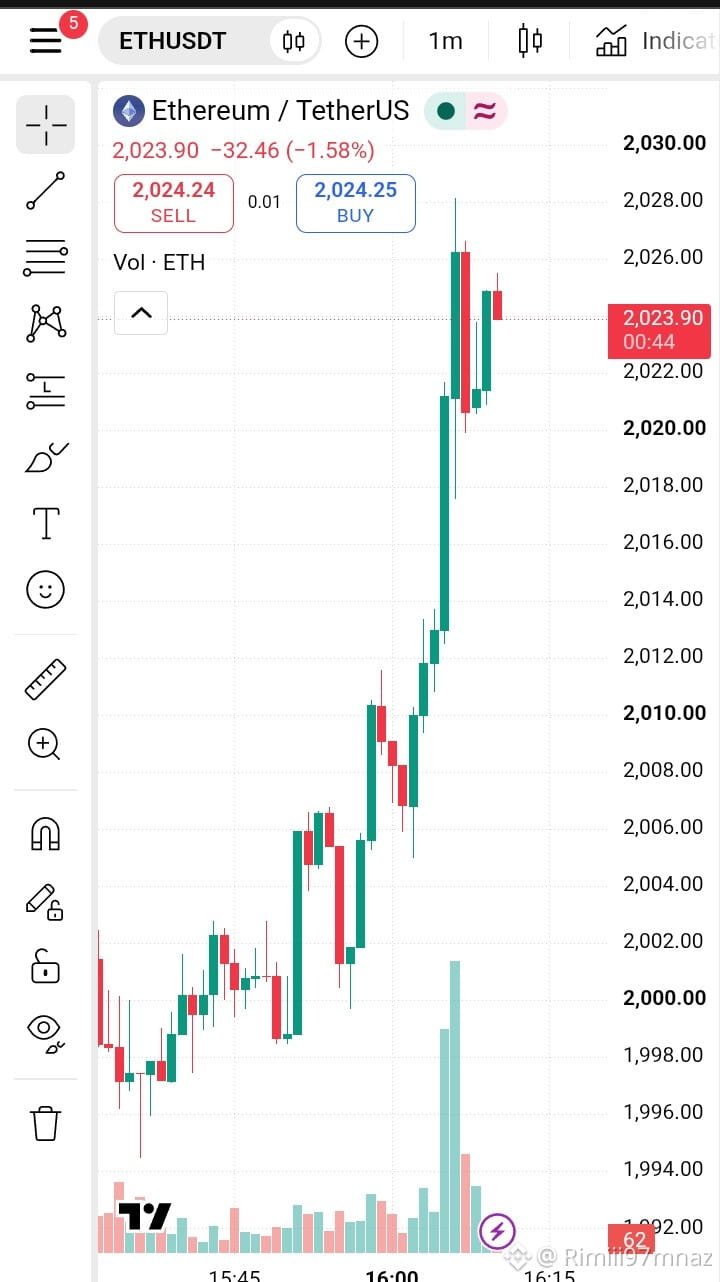
Ethereum is currently trading around $2,050, facing significant selling pressure. The overall market structure remains bearish, and traders are closely watching the psychological $2,000 support level.
1. Current Market Structure
$ETH is showing weakness on both the 4-hour and daily timeframes. Sellers are currently controlling the market, while buyers are attempting to defend important support zones.
2. Important Support Levels
• $2,032 – Immediate support
• $1,993 – Second support
• $1,949 – Major lower support
3. Important Resistance Levels
• $2,101 – First resistance
• $2,147 – Second resistance
• $2,211 – Stronger recovery hurdle
4. Technical Indicators
The daily RSI is around 29.6, indicating oversold conditions. A temporary relief bounce is possible, but oversold conditions alone do not confirm a market reversal. MACD remains bearish.
5. Market Sentiment
Recent reports show approximately $144.8 million in US spot $ETH H ETF outflows, adding pressure to investor sentiment.
6. Bullish and Bearish Scenarios
Bullish: A move above $2,101 may open recovery toward $2,147 and $2,211.
Bearish: A loss of $1,993 puts $1,949 in focus.
7. Final Outlook
Ethereum remains under bearish pressure, but its oversold RSI makes a short-term bounce possible. Traders should wait for confirmation through price action and volume.
Can ETH recover above $2,200, or will sellers push it below $2,000?
#ETH #Ethereum m #CryptoAnalysis #BinanceSquareTalks re #Altcoins #TradingSignals ng
Ethereum is currently trading around $2,050, facing significant selling pressure. The overall market structure remains bearish, and traders are closely watching the psychological $2,000 support level.
1. Current Market Structure
$ETH is showing weakness on both the 4-hour and daily timeframes. Sellers are currently controlling the market, while buyers are attempting to defend important support zones.
2. Important Support Levels
• $2,032 – Immediate support
• $1,993 – Second support
• $1,949 – Major lower support
3. Important Resistance Levels
• $2,101 – First resistance
• $2,147 – Second resistance
• $2,211 – Stronger recovery hurdle
4. Technical Indicators
The daily RSI is around 29.6, indicating oversold conditions. A temporary relief bounce is possible, but oversold conditions alone do not confirm a market reversal. MACD remains bearish.
5. Market Sentiment
Recent reports show approximately $144.8 million in US spot $ETH H ETF outflows, adding pressure to investor sentiment.
6. Bullish and Bearish Scenarios
Bullish: A move above $2,101 may open recovery toward $2,147 and $2,211.
Bearish: A loss of $1,993 puts $1,949 in focus.
7. Final Outlook
Ethereum remains under bearish pressure, but its oversold RSI makes a short-term bounce possible. Traders should wait for confirmation through price action and volume.
Can ETH recover above $2,200, or will sellers push it below $2,000?
#ETH #Ethereum m #CryptoAnalysis #BinanceSquareTalks re #Altcoins #TradingSignals ng