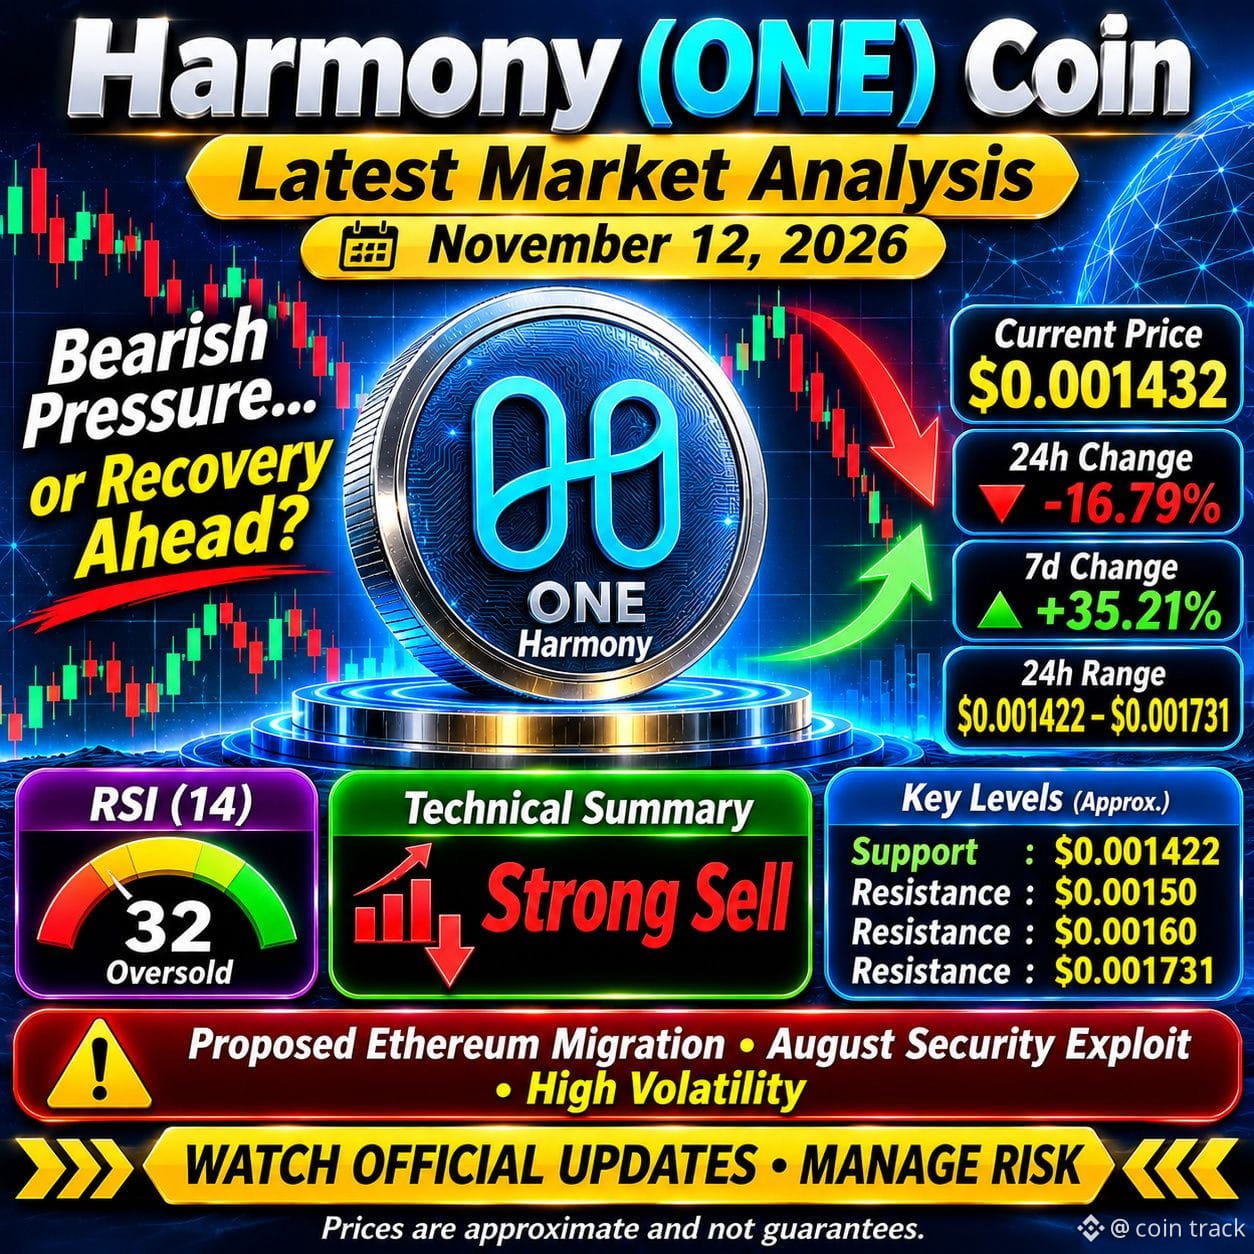
Harmony ($ONE ) Coin Latest Market Analysis – November 12, 2026
Strong sell – Short-term trend
High volatility
Harmony (ONE): Can Buyers Trigger a Strong Recovery?
Harmony (ONE) is experiencing significant volatility after a sharp price reversal. Despite gaining more than 35% over the past seven days, the token has dropped approximately 16.79% in the last 24 hours.
As of November 12, ONE is trading around $0.001432, with selling pressure dominating its short-term technical structure.
One of the biggest developments affecting Harmony is its proposed migration from its original Layer-1 blockchain to Ethereum. The project has also faced security concerns following an August exploit involving unauthorized token minting. These developments have created uncertainty among investors.
1. Latest $ONE Market Overview
Harmony (ONE)
-16.79% · 24H
$0.001432
Latest reported market snapshot – November 12, 2026
7-day performance
+35.21%
Market capitalization
$23.69M
24-hour range
$0.001422–$0.001731
Circulating supply
16.49B ONE
Source: CoinGlass market snapshot.
2. $ONE Technical Analysis
The short-term technical outlook is bearish.
Important indicators:
RSI (14): Approximately 32, approaching oversold territory.
MACD: Bearish signal.
Moving averages: Strong sell.
Daily trend: Bearish.
Weekly trend: Strong sell according to the latest technical summary.
Important price levels:
Level
Price
Current price
$0.001432
Immediate support
$0.001422
First resistance
$0.00150
Major resistance
$0.00160
Strong resistance
$0.001731
The immediate support and resistance levels are based on the latest reported daily trading range, not independently confirmed historical support zones.
#HuangExitNvidiaStrategyInFocus #AnthropicRejectsIPODelayValuationinQuestion #BitMineReports$6.3BNetLossForFiscal2026 #ChipStocksExtendLossesAfterNvidiaCEOChange
Strong sell – Short-term trend
High volatility
Harmony (ONE): Can Buyers Trigger a Strong Recovery?
Harmony (ONE) is experiencing significant volatility after a sharp price reversal. Despite gaining more than 35% over the past seven days, the token has dropped approximately 16.79% in the last 24 hours.
As of November 12, ONE is trading around $0.001432, with selling pressure dominating its short-term technical structure.
One of the biggest developments affecting Harmony is its proposed migration from its original Layer-1 blockchain to Ethereum. The project has also faced security concerns following an August exploit involving unauthorized token minting. These developments have created uncertainty among investors.
1. Latest $ONE Market Overview
Harmony (ONE)
-16.79% · 24H
$0.001432
Latest reported market snapshot – November 12, 2026
7-day performance
+35.21%
Market capitalization
$23.69M
24-hour range
$0.001422–$0.001731
Circulating supply
16.49B ONE
Source: CoinGlass market snapshot.
2. $ONE Technical Analysis
The short-term technical outlook is bearish.
Important indicators:
RSI (14): Approximately 32, approaching oversold territory.
MACD: Bearish signal.
Moving averages: Strong sell.
Daily trend: Bearish.
Weekly trend: Strong sell according to the latest technical summary.
Important price levels:
Level
Price
Current price
$0.001432
Immediate support
$0.001422
First resistance
$0.00150
Major resistance
$0.00160
Strong resistance
$0.001731
The immediate support and resistance levels are based on the latest reported daily trading range, not independently confirmed historical support zones.
#HuangExitNvidiaStrategyInFocus #AnthropicRejectsIPODelayValuationinQuestion #BitMineReports$6.3BNetLossForFiscal2026 #ChipStocksExtendLossesAfterNvidiaCEOChange