🚨 BITCOIN 1D CHART: IS THE NEXT BIG RECOVERY ABOUT TO BEGIN? 📈
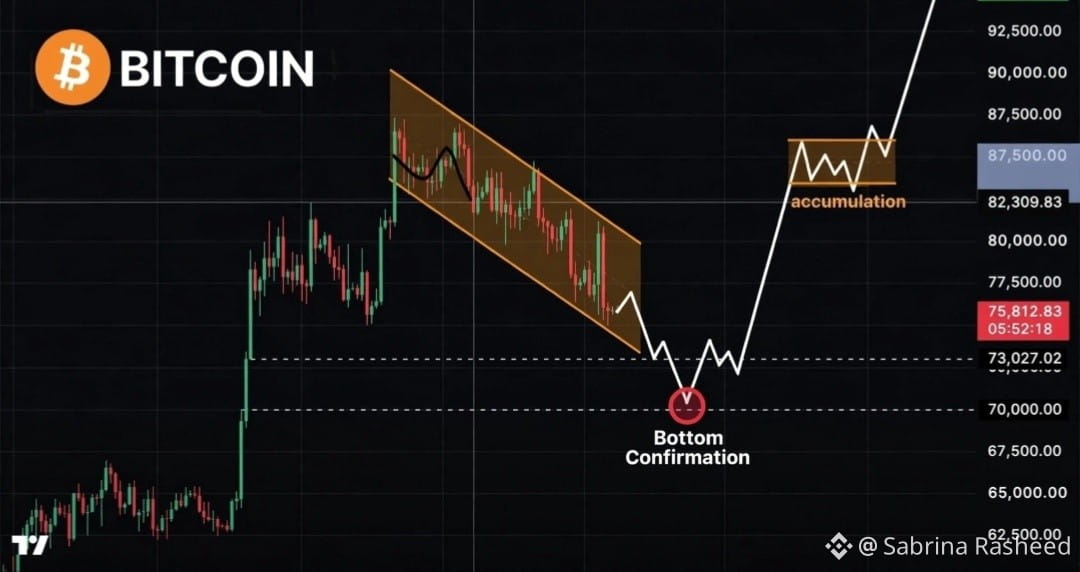
$BTC is showing a potential bottom-to-recovery structure on the daily chart. Bulls may be preparing for another major upward move.
🔍 Key Technical Observations:
1️⃣ The Major Drop: BTC declined through a descending channel, falling from around $87K toward the $70K zone after the September rally.
2️⃣ Bottom Formation: Price formed a potential double bottom around $70K–$73K, creating an important reversal zone.
3️⃣ Current Accumulation: BTC is consolidating between $83K and $86K. A confirmed breakout could signal renewed bullish momentum.
4️⃣ Mid-Term Target: 🎯 $95,000
🚀 What's Next?
If Bitcoin breaks above the $86K resistance zone with strong momentum, a move toward $95K could become possible.
⚠️ However, rejection from resistance could lead to further consolidation or another pullback. Confirmation is key!
👀 Can BTC break $86K and make its next run toward $95,000?
#BTC #Bitcoin #BTCAnalysis #CryptoMarket #BullishTrend #BinanceSquare
$BTC is showing a potential bottom-to-recovery structure on the daily chart. Bulls may be preparing for another major upward move.
🔍 Key Technical Observations:
1️⃣ The Major Drop: BTC declined through a descending channel, falling from around $87K toward the $70K zone after the September rally.
2️⃣ Bottom Formation: Price formed a potential double bottom around $70K–$73K, creating an important reversal zone.
3️⃣ Current Accumulation: BTC is consolidating between $83K and $86K. A confirmed breakout could signal renewed bullish momentum.
4️⃣ Mid-Term Target: 🎯 $95,000
🚀 What's Next?
If Bitcoin breaks above the $86K resistance zone with strong momentum, a move toward $95K could become possible.
⚠️ However, rejection from resistance could lead to further consolidation or another pullback. Confirmation is key!
👀 Can BTC break $86K and make its next run toward $95,000?
#BTC #Bitcoin #BTCAnalysis #CryptoMarket #BullishTrend #BinanceSquare