$DASH : Volume Apophenia
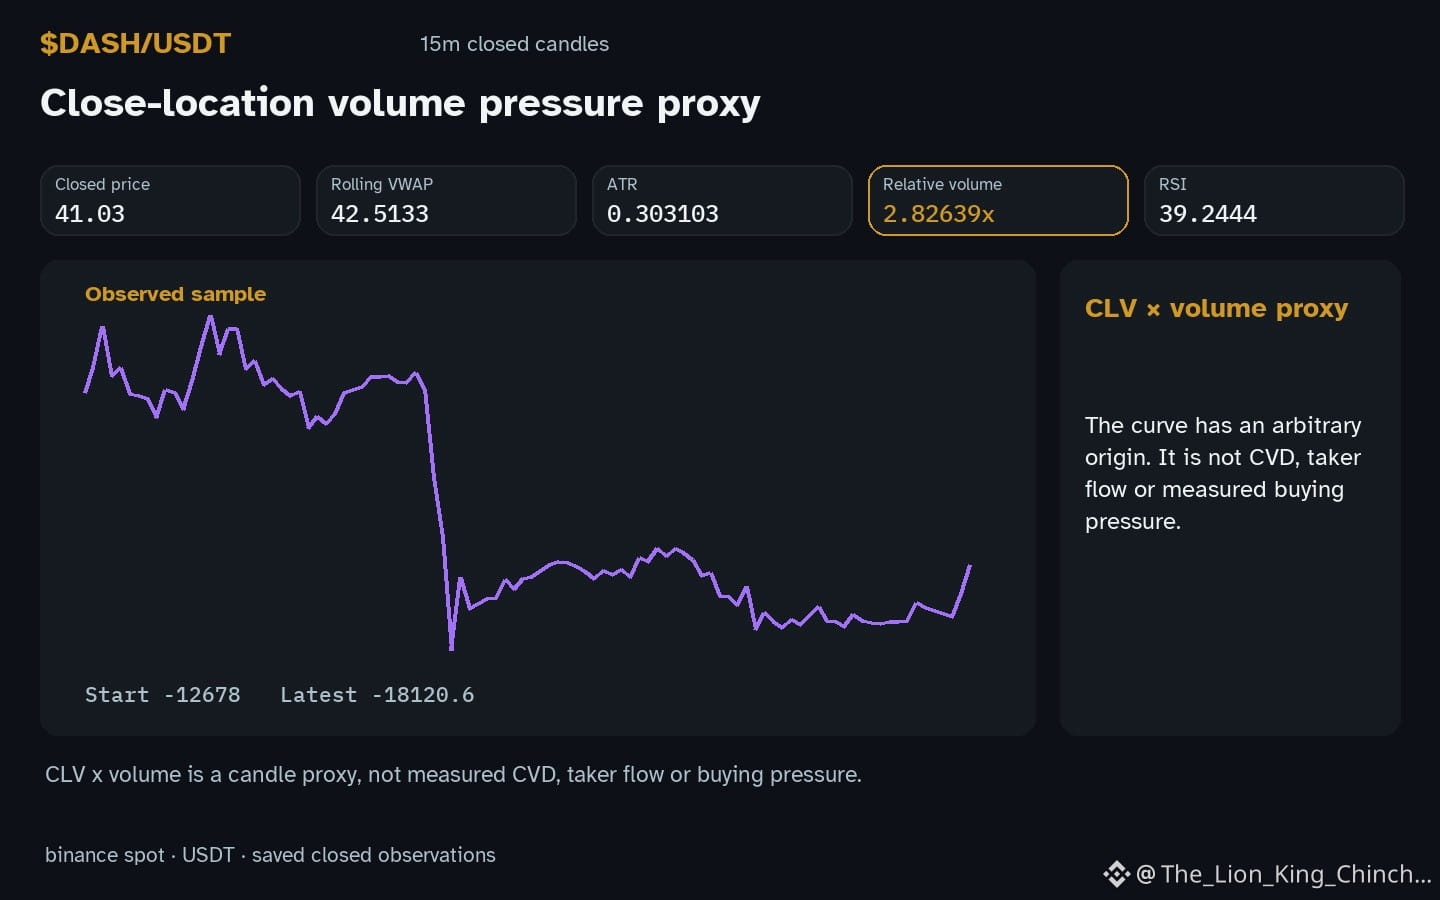
Is $DASH volume genuinely unusual, or are we seeing patterns in noise? The current reading shows volume at 2.83x baseline while price stays inside the recorded range, with an hourly direction described as down. This combination often triggers a quick mental story: a spike must mean large activity, or a dip indicates panic. That is where the bias starts. We call it apophenia, the feeling that random data contains hidden meaning. A trader might anchor on the higher relative volume and assume significant participation without checking other context. The volume could simply reflect normal market rhythm, such as a scheduled liquidity event or routine turnover in the underlying pair. There is no proof of institutional entry or exit from this ratio alone. Consider a counterexample: volume rises, but price respects local support at 40.24 and resistance at 41.76. If the move remains small and contained, the volume spike may not change the trend. It might just be noise amplified by attention. A useful self-check is to ask: what specific closed-candle pattern would prove this volume was significant? Look for a break of the local range or a sustained shift in price structure. If the next few hourly candles close back within the previous bounds, the initial interpretation of major activity weakens. RSI at 39.2 offers no confirmation of exhaustion or accumulation; it is just a momentum indicator. Do not infer motives from a single volume number. Instead, wait for price to react to the local levels. If price fails to break 41.76 despite the elevated volume, the hypothesis of intense buying fails. Conversely, if it breaks decisively, the volume gains weight. Focus on the result, not the volume alone. This approach prevents the mind from constructing narratives that justify pre-existing beliefs. The market provides data, not intent. Let the structure confirm the signal before acting on the volume spike.
Probabilistic market research, not a recommendation or guaranteed return.
#DASH
Is $DASH volume genuinely unusual, or are we seeing patterns in noise? The current reading shows volume at 2.83x baseline while price stays inside the recorded range, with an hourly direction described as down. This combination often triggers a quick mental story: a spike must mean large activity, or a dip indicates panic. That is where the bias starts. We call it apophenia, the feeling that random data contains hidden meaning. A trader might anchor on the higher relative volume and assume significant participation without checking other context. The volume could simply reflect normal market rhythm, such as a scheduled liquidity event or routine turnover in the underlying pair. There is no proof of institutional entry or exit from this ratio alone. Consider a counterexample: volume rises, but price respects local support at 40.24 and resistance at 41.76. If the move remains small and contained, the volume spike may not change the trend. It might just be noise amplified by attention. A useful self-check is to ask: what specific closed-candle pattern would prove this volume was significant? Look for a break of the local range or a sustained shift in price structure. If the next few hourly candles close back within the previous bounds, the initial interpretation of major activity weakens. RSI at 39.2 offers no confirmation of exhaustion or accumulation; it is just a momentum indicator. Do not infer motives from a single volume number. Instead, wait for price to react to the local levels. If price fails to break 41.76 despite the elevated volume, the hypothesis of intense buying fails. Conversely, if it breaks decisively, the volume gains weight. Focus on the result, not the volume alone. This approach prevents the mind from constructing narratives that justify pre-existing beliefs. The market provides data, not intent. Let the structure confirm the signal before acting on the volume spike.
Probabilistic market research, not a recommendation or guaranteed return.
#DASH