$AIA — Is a Trend Reversal Finally Taking Shape? Bulls Are Fighting Back!
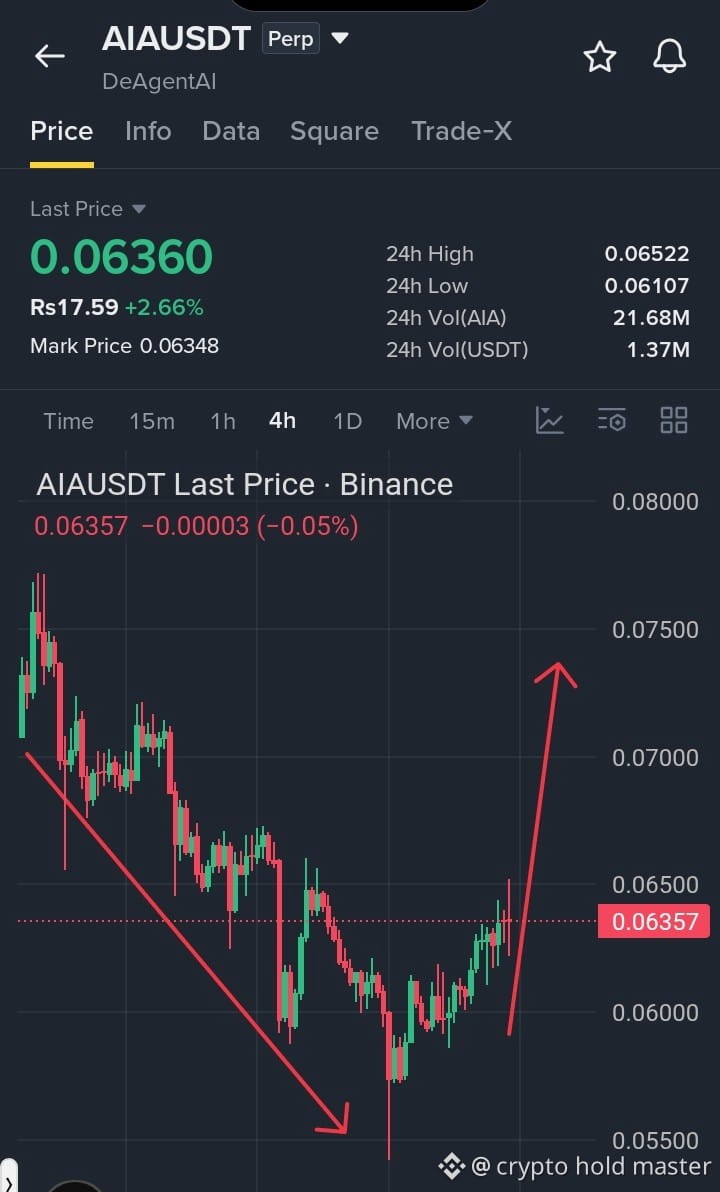
$AIA is showing encouraging recovery signs on the 4H chart after a prolonged downtrend. Price has bounced strongly from the $0.055 region and is now trading around $0.0636.
The structure is improving, and a breakout above nearby resistance could open the door for another bullish move.
AIA LONG SETUP
Entry Zone: $0.0620 – $0.0635
SL: $0.0590
TP1: $0.0660
TP2: $0.0690
TP3: $0.0730
Final TP: $0.0750
Technical Outlook:
Buyers are gradually regaining momentum after defending the recent lows. A confirmed breakout above $0.0650 would strengthen the bullish case and could send $AIA toward $0.0700–$0.0750.
However, losing $0.0590 would weaken this recovery structure and invalidate the setup.
Watch the resistance breakout before entering, and manage your risk carefully.
Can #AIA reclaim $0.0700 and surprise the market with another strong rally?
$AIA is showing encouraging recovery signs on the 4H chart after a prolonged downtrend. Price has bounced strongly from the $0.055 region and is now trading around $0.0636.
The structure is improving, and a breakout above nearby resistance could open the door for another bullish move.
AIA LONG SETUP
Entry Zone: $0.0620 – $0.0635
SL: $0.0590
TP1: $0.0660
TP2: $0.0690
TP3: $0.0730
Final TP: $0.0750
Technical Outlook:
Buyers are gradually regaining momentum after defending the recent lows. A confirmed breakout above $0.0650 would strengthen the bullish case and could send $AIA toward $0.0700–$0.0750.
However, losing $0.0590 would weaken this recovery structure and invalidate the setup.
Watch the resistance breakout before entering, and manage your risk carefully.
Can #AIA reclaim $0.0700 and surprise the market with another strong rally?