
$BNB — Sellers Are Taking Control! Can Buyers Defend $659?
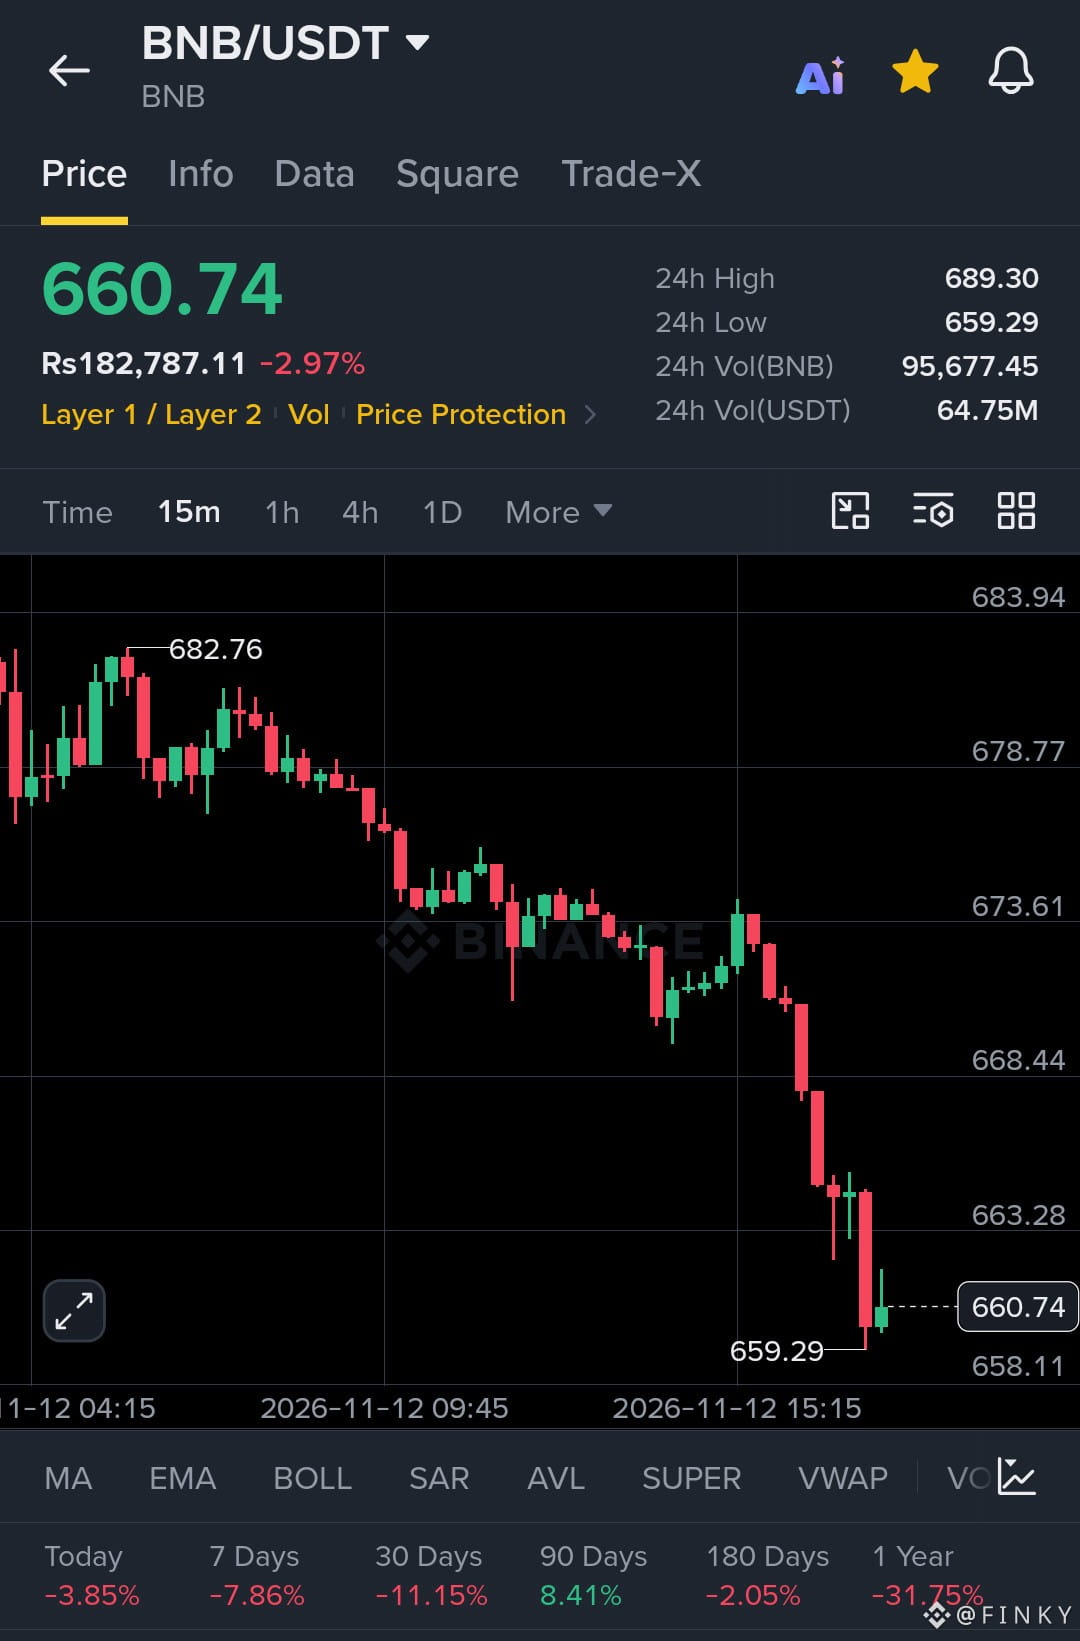
BNB is trading around $660.74, down nearly 3%. The 15-minute chart shows strong selling pressure, with lower highs and lower lows. Price has dropped sharply from the $682.76 area and is now testing an important support zone.
The key level is $659.29. If buyers defend this area and reclaim $663.28, a short-term recovery could begin.
Trade Setup – Potential Long
EP: $660 – $663
SL: $656
TP1: $668.44
TP2: $673.61
TP3: $678.77
Bullish Trigger: A solid 15-minute close above $663.28 could open the way toward higher resistance.
Bearish Scenario: If $659.29 breaks, BNB could face another move lower. Avoid rushing into a long while sellers remain in control.
I'm watching the reaction at support. No confirmation, no trade. Cash is a position.
Will BNB bounce from $659, or are sellers preparing another breakdown?
Let's go $BNB
#HuangRisksOusterOverReportedAffairWithSubordinate #AnthropicRejectsIPODelayValuationinQuestion #CanNvidiaEarningsEaseMarketConcerns? #PythAddsNYSERealTimeDataToMarketplace
BNB is trading around $660.74, down nearly 3%. The 15-minute chart shows strong selling pressure, with lower highs and lower lows. Price has dropped sharply from the $682.76 area and is now testing an important support zone.
The key level is $659.29. If buyers defend this area and reclaim $663.28, a short-term recovery could begin.
Trade Setup – Potential Long
EP: $660 – $663
SL: $656
TP1: $668.44
TP2: $673.61
TP3: $678.77
Bullish Trigger: A solid 15-minute close above $663.28 could open the way toward higher resistance.
Bearish Scenario: If $659.29 breaks, BNB could face another move lower. Avoid rushing into a long while sellers remain in control.
I'm watching the reaction at support. No confirmation, no trade. Cash is a position.
Will BNB bounce from $659, or are sellers preparing another breakdown?
Let's go $BNB
#HuangRisksOusterOverReportedAffairWithSubordinate #AnthropicRejectsIPODelayValuationinQuestion #CanNvidiaEarningsEaseMarketConcerns? #PythAddsNYSERealTimeDataToMarketplace