$ETH: Contrasting Participation in Synchronized Moves
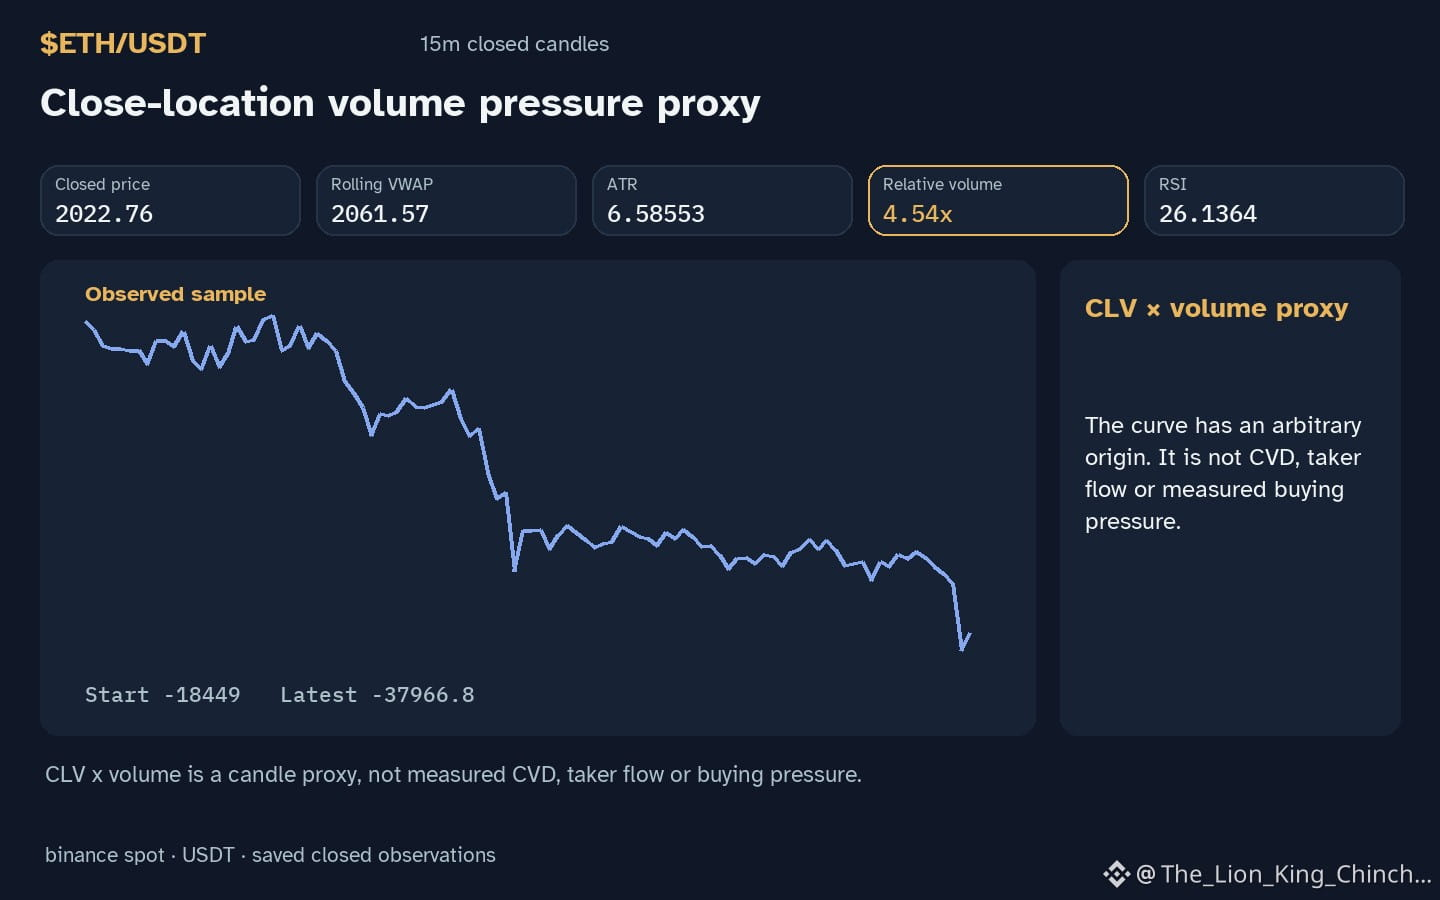
$ETH: Does a shared hourly direction imply a common market mechanism, or can similar moves hide different levels of conviction? In the current setup, $ETH shows a down hourly direction while trading below support. Although several assets exhibit matching downward trajectories, their relationship to volume baselines varies significantly, suggesting that price alignment does not always mean participation is uniform. A down move on high volume might represent a different hypothetical scenario than the same move on low volume.
Consider two peer assets. BTC currently displays a down hourly direction with volume above its baseline. In contrast, ERA moves in the same down direction, yet its volume remains below its baseline. This disparity illustrates that even when price action looks identical across a venue, the relative activity levels can diverge. High relative volume 4.54x during a price drop could suggest an increase in participation, whereas lower volume might indicate a lack of recent interest during the same move.
This analogy fails if one assumes these observations prove a broader market rotation or causal link. These measurements are limited to the current candle and do not predict future trend continuation. To reassess this interpretation, one should look for a future closed candle where $ETH moves against the peer direction while relative volume remains elevated ☖.
Probabilistic market research, not a recommendation or guaranteed return.
Watchlist contrast: $BTC has hourly direction down and volume above its baseline; $ERA has hourly direction down and volume not above its baseline. This alone does not establish correlation.
#ETH #BTC #ERA #CryptoWatchlist #CryptoLearning
$ETH: Does a shared hourly direction imply a common market mechanism, or can similar moves hide different levels of conviction? In the current setup, $ETH shows a down hourly direction while trading below support. Although several assets exhibit matching downward trajectories, their relationship to volume baselines varies significantly, suggesting that price alignment does not always mean participation is uniform. A down move on high volume might represent a different hypothetical scenario than the same move on low volume.
Consider two peer assets. BTC currently displays a down hourly direction with volume above its baseline. In contrast, ERA moves in the same down direction, yet its volume remains below its baseline. This disparity illustrates that even when price action looks identical across a venue, the relative activity levels can diverge. High relative volume 4.54x during a price drop could suggest an increase in participation, whereas lower volume might indicate a lack of recent interest during the same move.
This analogy fails if one assumes these observations prove a broader market rotation or causal link. These measurements are limited to the current candle and do not predict future trend continuation. To reassess this interpretation, one should look for a future closed candle where $ETH moves against the peer direction while relative volume remains elevated ☖.
Probabilistic market research, not a recommendation or guaranteed return.
Watchlist contrast: $BTC has hourly direction down and volume above its baseline; $ERA has hourly direction down and volume not above its baseline. This alone does not establish correlation.
#ETH #BTC #ERA #CryptoWatchlist #CryptoLearning