$BTC: Consistency in Measurement Baselines
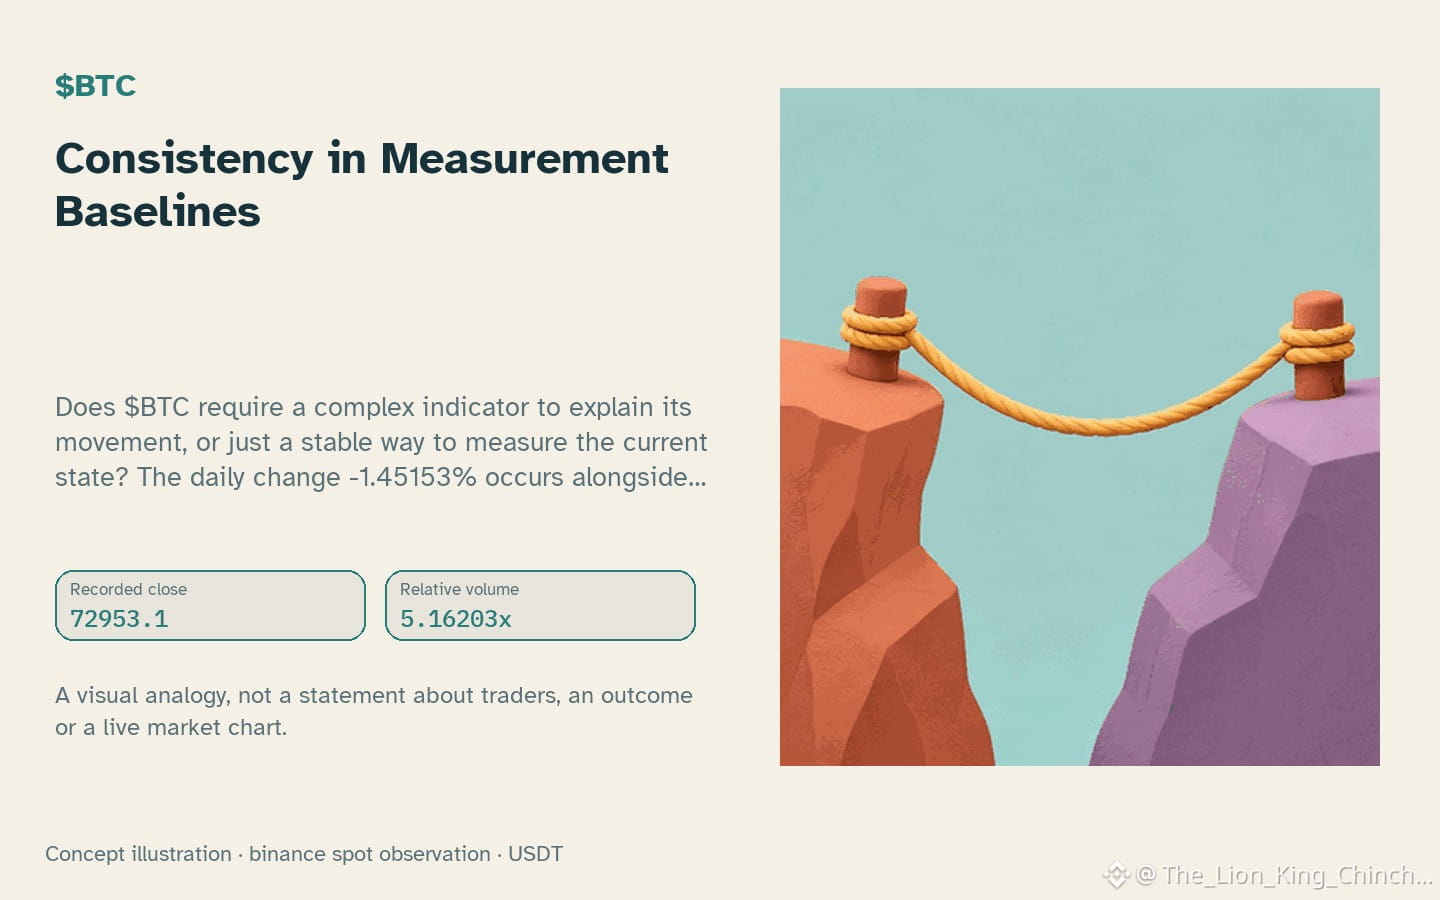
Does $BTC require a complex indicator to explain its movement, or just a stable way to measure the current state? The daily change -1.45153% occurs alongside volume at 5.16x baseline.
Standardized observation baselines are hypothetical tools to compare current activity against a fixed past. This removes the urge to change rules when price looks fast. Consider a thought experiment where an observer waits for a price to hit a level versus acting immediately. Waiting may improve entry quality by securing a better price, but it risks missing the move entirely. Conversely, acting early provides a clear invalidation point but often results in a larger distance to a stop. This trade-off between entry quality and meaningful invalidation is a constant friction in systematic research.
A counterexample exists when a metric like RSI 28.0 suggests a specific speed, yet the price remains below resistance 73696.9. If the observer changes the baseline to fit the current candles, the logic fails because the measurement is no longer independent. Reassessing this interpretation requires looking for a closed candle above local resistance to see if the downward hourly direction persists despite the high relative volume.
Probabilistic market research, not a recommendation or guaranteed return.
For a wider view: $ETH has hourly direction down and volume above its baseline; $ERA has hourly direction down and volume not above its baseline. This alone does not establish correlation.
#BTC #ETH #ERA
Does $BTC require a complex indicator to explain its movement, or just a stable way to measure the current state? The daily change -1.45153% occurs alongside volume at 5.16x baseline.
Standardized observation baselines are hypothetical tools to compare current activity against a fixed past. This removes the urge to change rules when price looks fast. Consider a thought experiment where an observer waits for a price to hit a level versus acting immediately. Waiting may improve entry quality by securing a better price, but it risks missing the move entirely. Conversely, acting early provides a clear invalidation point but often results in a larger distance to a stop. This trade-off between entry quality and meaningful invalidation is a constant friction in systematic research.
A counterexample exists when a metric like RSI 28.0 suggests a specific speed, yet the price remains below resistance 73696.9. If the observer changes the baseline to fit the current candles, the logic fails because the measurement is no longer independent. Reassessing this interpretation requires looking for a closed candle above local resistance to see if the downward hourly direction persists despite the high relative volume.
Probabilistic market research, not a recommendation or guaranteed return.
For a wider view: $ETH has hourly direction down and volume above its baseline; $ERA has hourly direction down and volume not above its baseline. This alone does not establish correlation.
#BTC #ETH #ERA