

Caldera (ERA) is attracting attention after climbing approximately 8.29%, with its price trading around $0.0940.
But what makes this move interesting is not just the daily gain. The four-timeframe chart structure shows something worth watching: ERA is trading above all three major moving averages across the 15-minute, 1-hour, 4-hour and daily charts.
Is this the beginning of another upward move, or could buyers lose momentum near resistance?
Let's examine the charts.
1. 15-Minute Chart: Short-Term Momentum Needs Strength
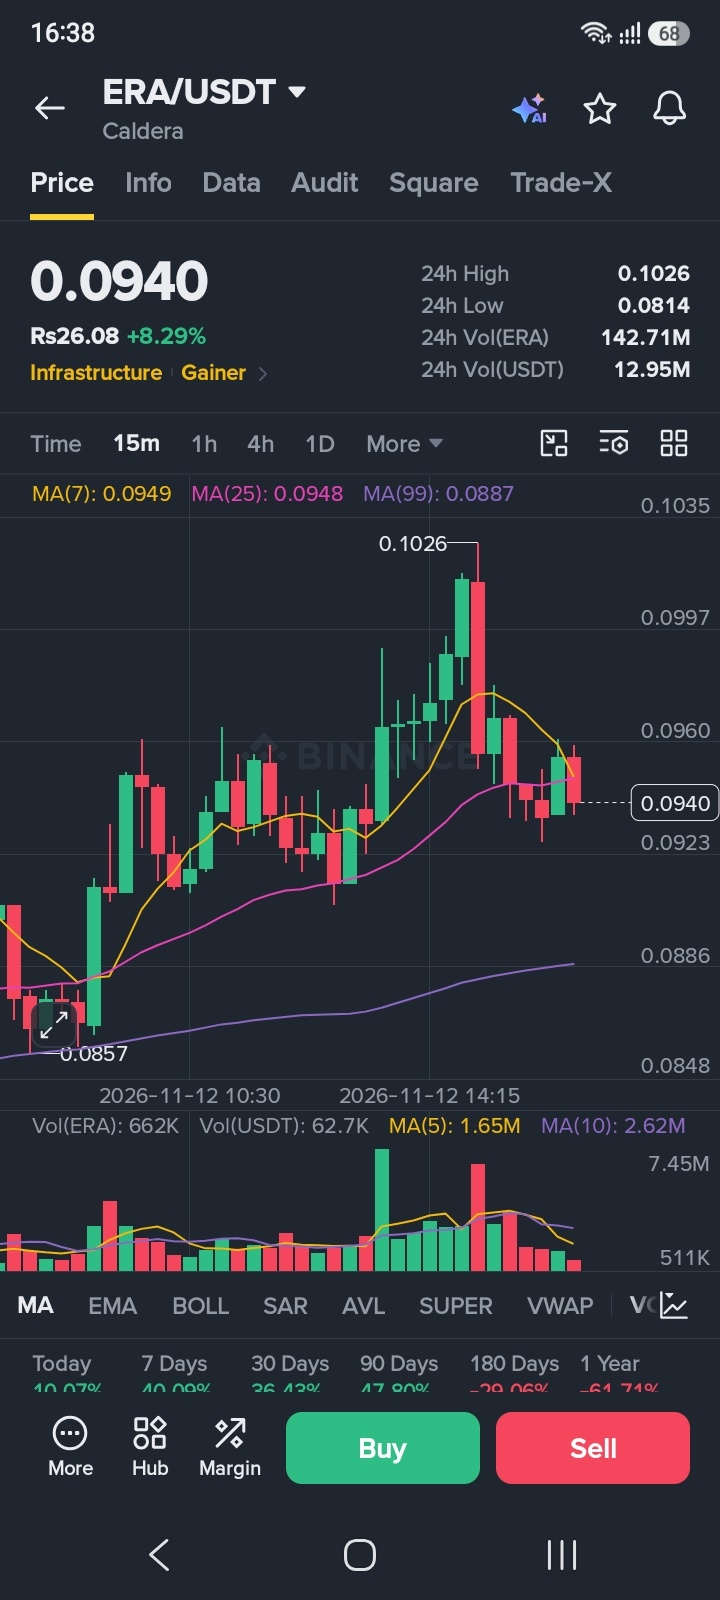
Price: $0.0940
MA(7): $0.0949
MA(25): $0.0948
MA(99): $0.0887
Candle volume: 662K ERA
Volume MA(5): 1.65M
Volume MA(10): 2.62M
Price is slightly below MA(7) and MA(25), but remains above MA(99).
This suggests that the immediate short-term momentum has cooled. Volume is also considerably below its averages, so buyers need to return with stronger participation.
2. 1-Hour Chart: Bullish Structure Still Intact
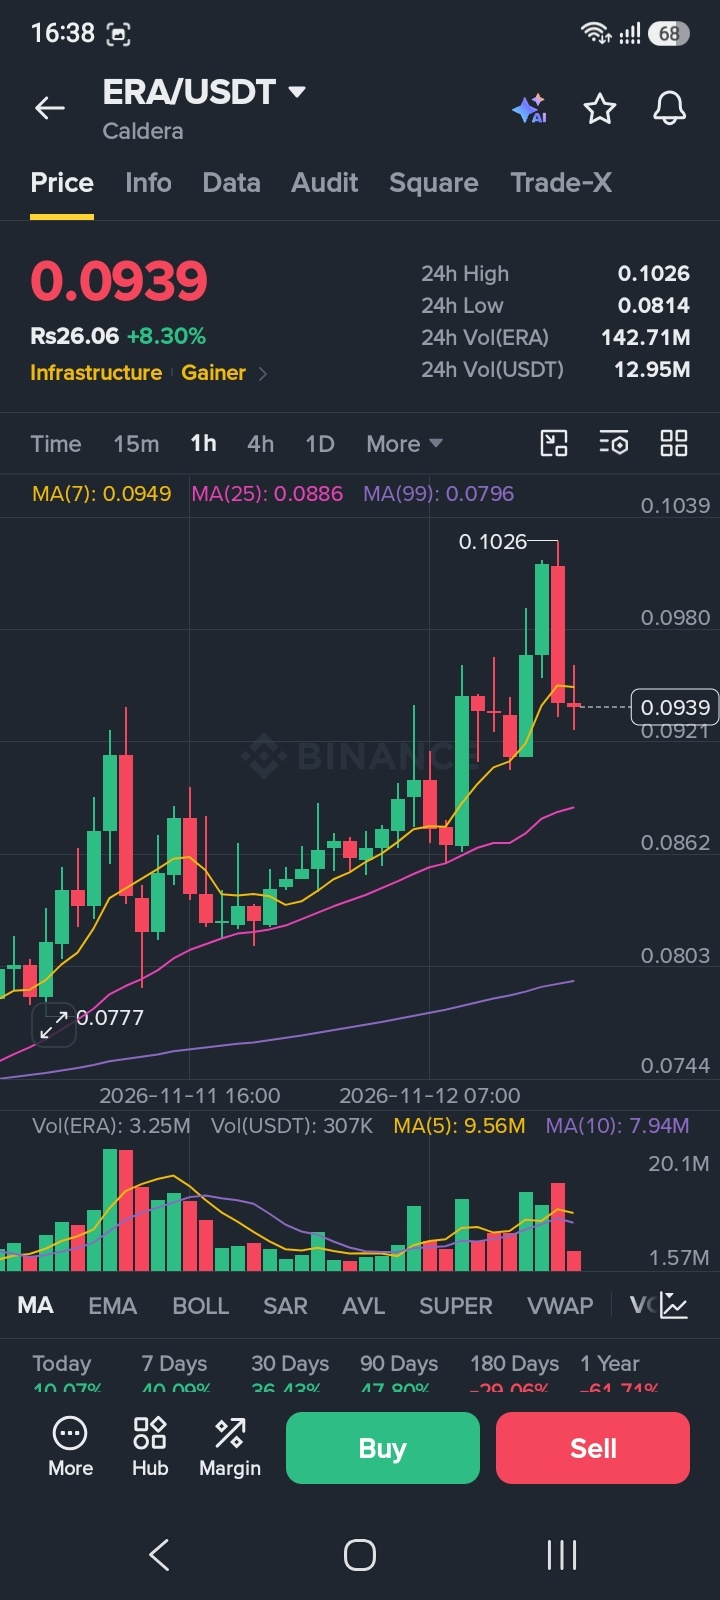
Price: $0.0939
MA(7): $0.0949
MA(25): $0.0886
MA(99): $0.0796
Candle volume: 3.25M ERA
Volume MA(5): 9.56M
Volume MA(10): 7.94M
The price remains above MA(25) and MA(99), maintaining a positive hourly structure.
However, it is slightly below MA(7), while candle volume is below both volume averages. A recovery above the short-term moving average with stronger volume would improve the picture.
3. 4-Hour Chart: Strong Bullish Alignment
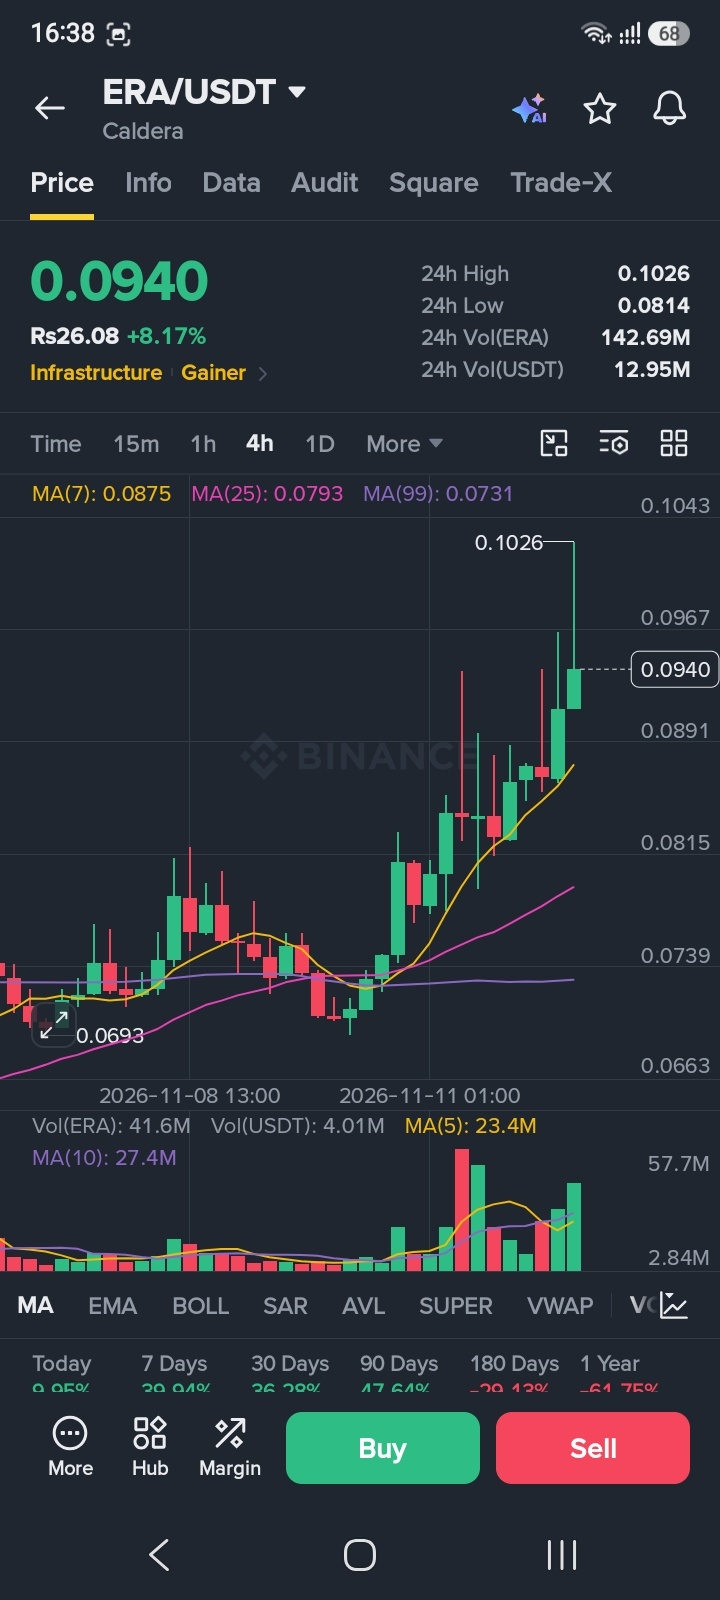
Price: $0.0940
MA(7): $0.0875
MA(25): $0.0793
MA(99): $0.0731
Candle volume: 41.6M ERA
Volume MA(5): 23.4M
Volume MA(10): 27.4M
This is one of the strongest parts of the current setup.
Price is comfortably above all three moving averages, and candle volume is higher than both volume averages.
That combination supports the positive medium-term trend, although it does not guarantee that the rally will continue.
4. Daily Chart: Bigger Trend Remains Positive
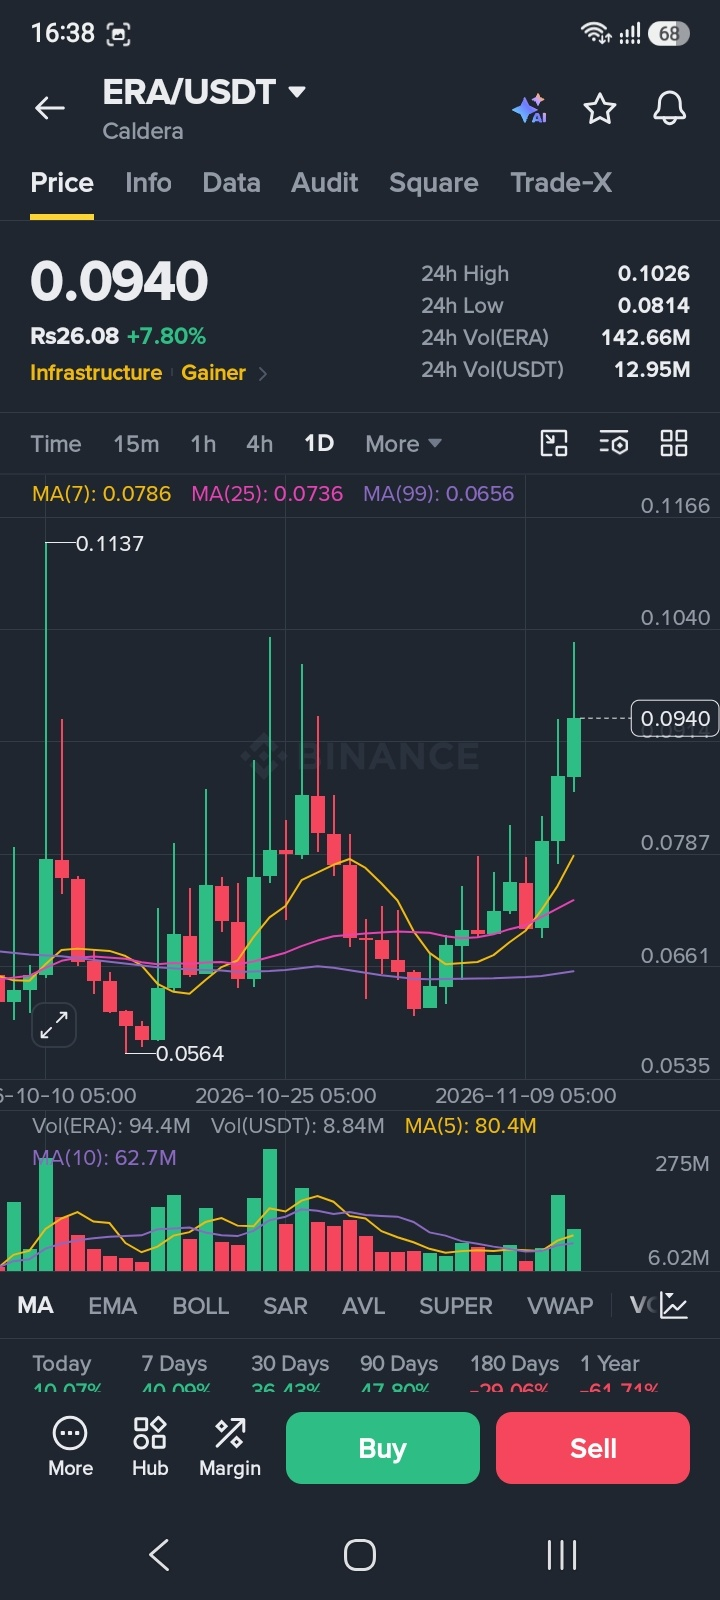
Price: $0.0940
MA(7): $0.0786
MA(25): $0.0736
MA(99): $0.0656
Candle volume: 94.4M ERA
Volume MA(5): 80.4M
Volume MA(10): 62.7M
The daily chart also shows a strong moving-average structure.
Price is above all three averages, while daily candle volume is higher than both volume averages. This indicates meaningful trading activity behind the broader upward move.
Important Levels to Watch
Resistance zones:
$0.0960–$0.0980: Near-term chart area to watch
$0.1026: Current 24-hour high
A confirmed move above $0.1026 could bring further upside interest.
Support zones:
$0.0921–$0.0940: Immediate price area
$0.0886–$0.0887: Important moving-average support zone
$0.0814: Current 24-hour low
What Could Happen Next?
Bullish scenario: If ERA regains short-term momentum, attracts stronger volume and breaks above $0.1026 convincingly, buyers could attempt another upward move.
Bearish scenario: If buyers fail to defend the $0.0921–$0.0886 area, the current rally could weaken and a deeper pullback may follow.
Final Verdict: Is ERA Worth Watching?
The bigger picture is encouraging.
The 4-hour and daily charts show positive moving-average alignment, supported by above-average candle volume. However, the 15-minute and 1-hour charts show weaker immediate momentum.
The key level is $0.1026. A convincing breakout with strong volume would make the bullish case more interesting.
For now, ERA deserves attention, but chasing the rally without confirmation could be risky.
Community question:
Can ERA break above $0.1026 and continue its rally, or will sellers step in first?
Are you watching Caldera, or do you see a stronger altcoin opportunity?
Share your view below!
Disclaimer: This analysis is based on the Binance chart snapshots supplied for November 12, 2026. It is for educational purposes only, not financial advice. Always conduct your own research and manage risk.
#ERA #Caldera #ERAUSDT #BinanceSquare #BinancePick #Altcoins #CryptoAnalysis #TechnicalAnalysis