🔥 $GRAM Technical Update: Key Levels & Momentum Breakdown
📊 1. Market Snapshot
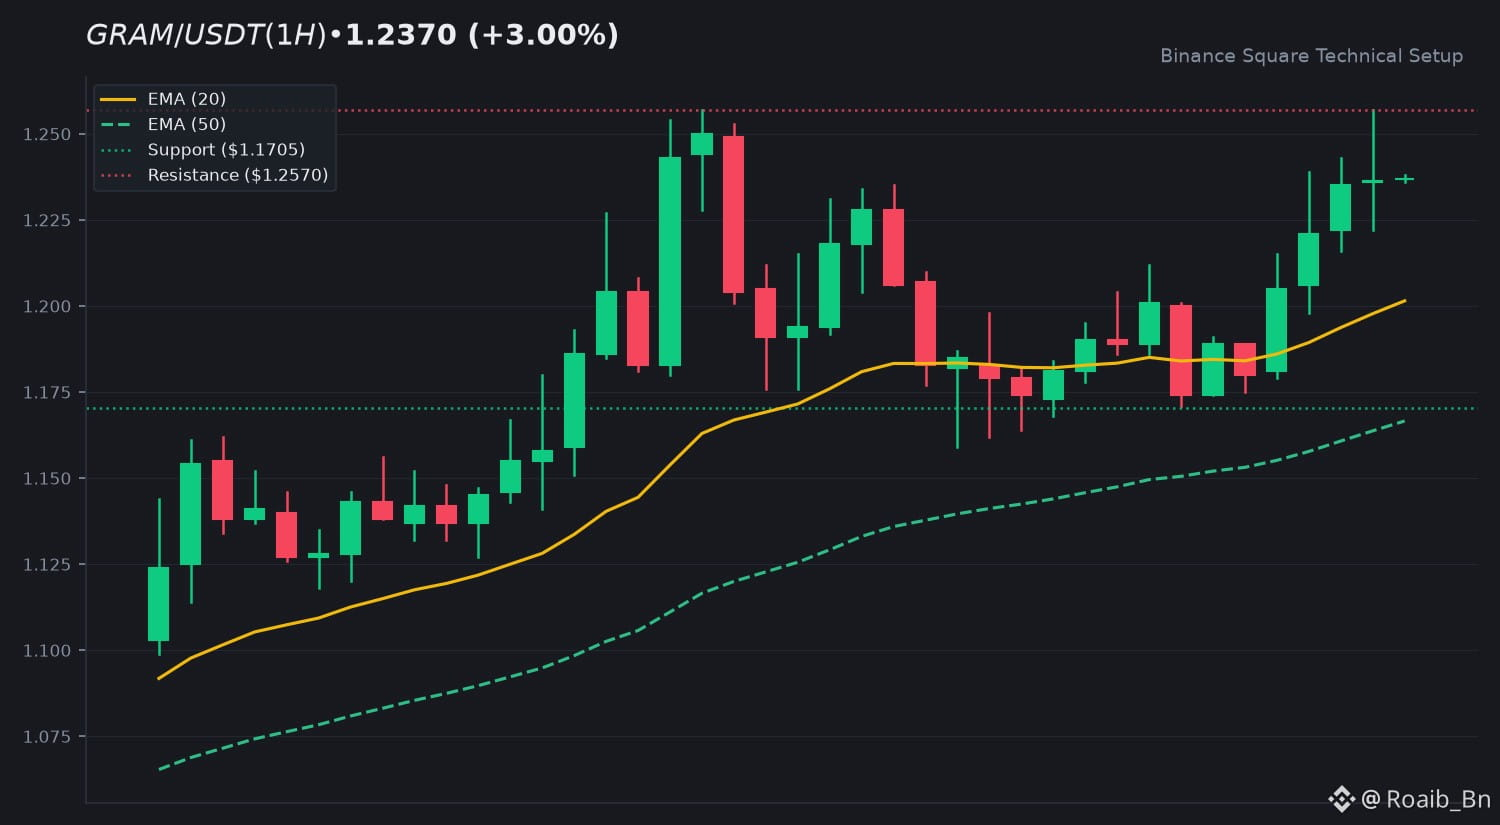
$GRAM is currently trading at 1.2370 USDT, reflecting a 3.00 percent increase over the last 24 hours. The asset shows steady price action with a total 24h quote volume of 24,619,162 USDT. While the current volume remains in a consolidation phase relative to the 20-SMA, the asset maintains a constructive posture within its current range.
📈 2. Technical Momentum & Indicator Bias
The price structure remains supported by the EMA 20 at 1.2015 and the EMA 50 at 1.1666, indicating a sustained bullish trend alignment. The RSI at 63.56 suggests moderate upward momentum without entering overbought territory. Furthermore, the MACD histogram is positive at 0.0029, with the MACD line positioned above the signal line, reinforcing the current trend bias.
🎯 3. Key Technical Levels to Watch
• 🟢 Resistance Zone: The immediate ceiling is at 1.2570, marking the 24h high.
• 🔴 Support Zone: The primary support floor sits at 1.1705, with secondary support located at 1.1225.
• 🛡️ Pivot Confluence: The 1.2015 level (EMA 20) serves as the primary pivot to monitor for continued trend health.
💡 4. Technical Takeaway & Risk Management
$GRAM exhibits a stable technical setup. Traders typically monitor the interaction between price action and the EMA 20 dynamic support. A failure to hold above this moving average might suggest a shift toward consolidation, while a clean break above 1.2570 could invite further observation of higher liquidity zones.
💬 5. Community Discussion
What is your technical outlook for $GRAM this week? Are you accumulating or waiting for confirmation? Drop your thoughts below! 👇
⚠️ 6. Disclaimer
Educational technical analysis only. Not financial advice (NFA). Crypto markets involve risk. Always DYOR.
$GRAM #GRAM #BinanceSquare
📊 1. Market Snapshot
$GRAM is currently trading at 1.2370 USDT, reflecting a 3.00 percent increase over the last 24 hours. The asset shows steady price action with a total 24h quote volume of 24,619,162 USDT. While the current volume remains in a consolidation phase relative to the 20-SMA, the asset maintains a constructive posture within its current range.
📈 2. Technical Momentum & Indicator Bias
The price structure remains supported by the EMA 20 at 1.2015 and the EMA 50 at 1.1666, indicating a sustained bullish trend alignment. The RSI at 63.56 suggests moderate upward momentum without entering overbought territory. Furthermore, the MACD histogram is positive at 0.0029, with the MACD line positioned above the signal line, reinforcing the current trend bias.
🎯 3. Key Technical Levels to Watch
• 🟢 Resistance Zone: The immediate ceiling is at 1.2570, marking the 24h high.
• 🔴 Support Zone: The primary support floor sits at 1.1705, with secondary support located at 1.1225.
• 🛡️ Pivot Confluence: The 1.2015 level (EMA 20) serves as the primary pivot to monitor for continued trend health.
💡 4. Technical Takeaway & Risk Management
$GRAM exhibits a stable technical setup. Traders typically monitor the interaction between price action and the EMA 20 dynamic support. A failure to hold above this moving average might suggest a shift toward consolidation, while a clean break above 1.2570 could invite further observation of higher liquidity zones.
💬 5. Community Discussion
What is your technical outlook for $GRAM this week? Are you accumulating or waiting for confirmation? Drop your thoughts below! 👇
⚠️ 6. Disclaimer
Educational technical analysis only. Not financial advice (NFA). Crypto markets involve risk. Always DYOR.
$GRAM #GRAM #BinanceSquare