Long/Short Data Analysis
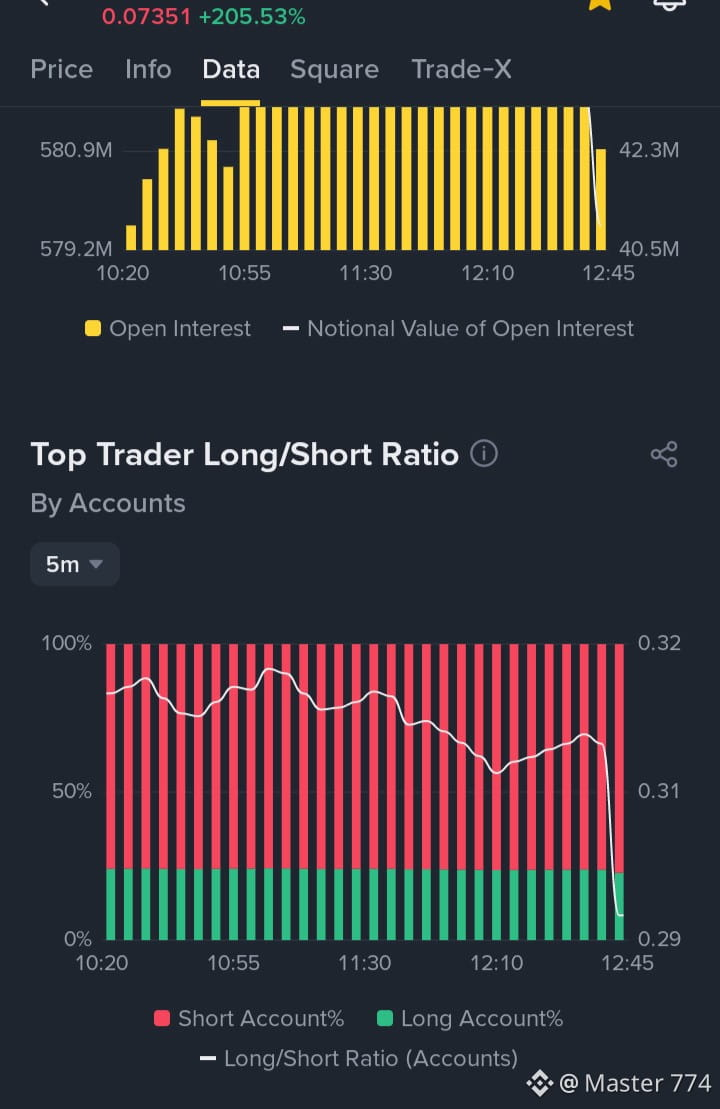
### 1\. Top Trader Long/Short Ratio (5m)
Short accounts
### ~77%
Long accounts
### ~23%
Long/Short ratio:
### 0.29–0.31
Approximate values read from the chart.
Meaning:
* Around 77% of top trader accounts are short.
* Only around 23% are long.
* Short positions heavily outnumber long positions by account count.
* The ratio recently dropped toward 0.29, showing an even stronger short-account imbalance.
### 2\. Open Interest (OI)
* Open Interest is elevated around 580M.
* Notional value is approximately 40.5M–42.3M.
* Both show a noticeable decline near 12:45.
This suggests some positions may be closing or leverage may be reducing.
### 3\. What could happen next?
Bullish scenario
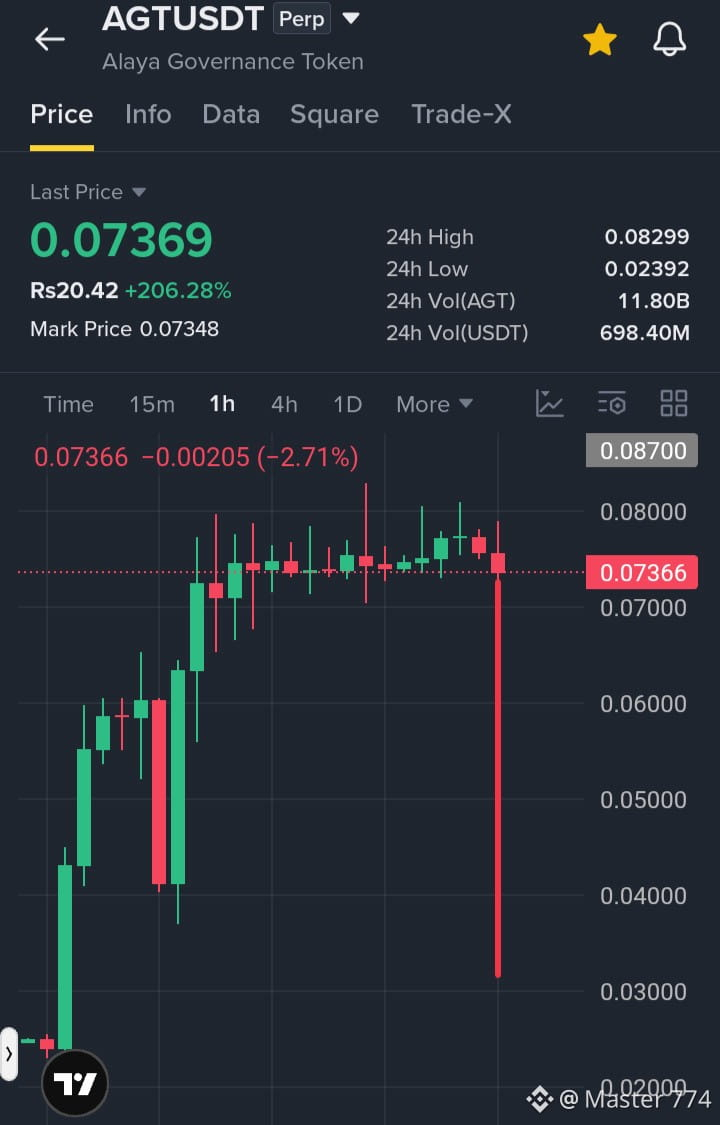
If price continues upward while shorts remain crowded, short liquidations could accelerate the rally. This creates a potential short squeeze.
Bearish scenario
If price loses support and OI declines further, leveraged longs or other positions may unwind, creating additional downside pressure.
### My conclusion
The data shows a heavily crowded short side. This creates potential fuel for another upward squeeze, but it does not guarantee a pump.
Important: Long/short ratio by accounts does not tell us the actual dollar size of long and short positions.
Trading strategy: Don't blindly chase. Watch price action, volume, OI changes and breakout confirmation before entering.
Short-heavy positioning can create opportunity, but confirmation matters more than sentiment.
### 1\. Top Trader Long/Short Ratio (5m)
Short accounts
### ~77%
Long accounts
### ~23%
Long/Short ratio:
### 0.29–0.31
Approximate values read from the chart.
Meaning:
* Around 77% of top trader accounts are short.
* Only around 23% are long.
* Short positions heavily outnumber long positions by account count.
* The ratio recently dropped toward 0.29, showing an even stronger short-account imbalance.
### 2\. Open Interest (OI)
* Open Interest is elevated around 580M.
* Notional value is approximately 40.5M–42.3M.
* Both show a noticeable decline near 12:45.
This suggests some positions may be closing or leverage may be reducing.
### 3\. What could happen next?
Bullish scenario
If price continues upward while shorts remain crowded, short liquidations could accelerate the rally. This creates a potential short squeeze.
Bearish scenario
If price loses support and OI declines further, leveraged longs or other positions may unwind, creating additional downside pressure.
### My conclusion
The data shows a heavily crowded short side. This creates potential fuel for another upward squeeze, but it does not guarantee a pump.
Important: Long/short ratio by accounts does not tell us the actual dollar size of long and short positions.
Trading strategy: Don't blindly chase. Watch price action, volume, OI changes and breakout confirmation before entering.
Short-heavy positioning can create opportunity, but confirmation matters more than sentiment.