

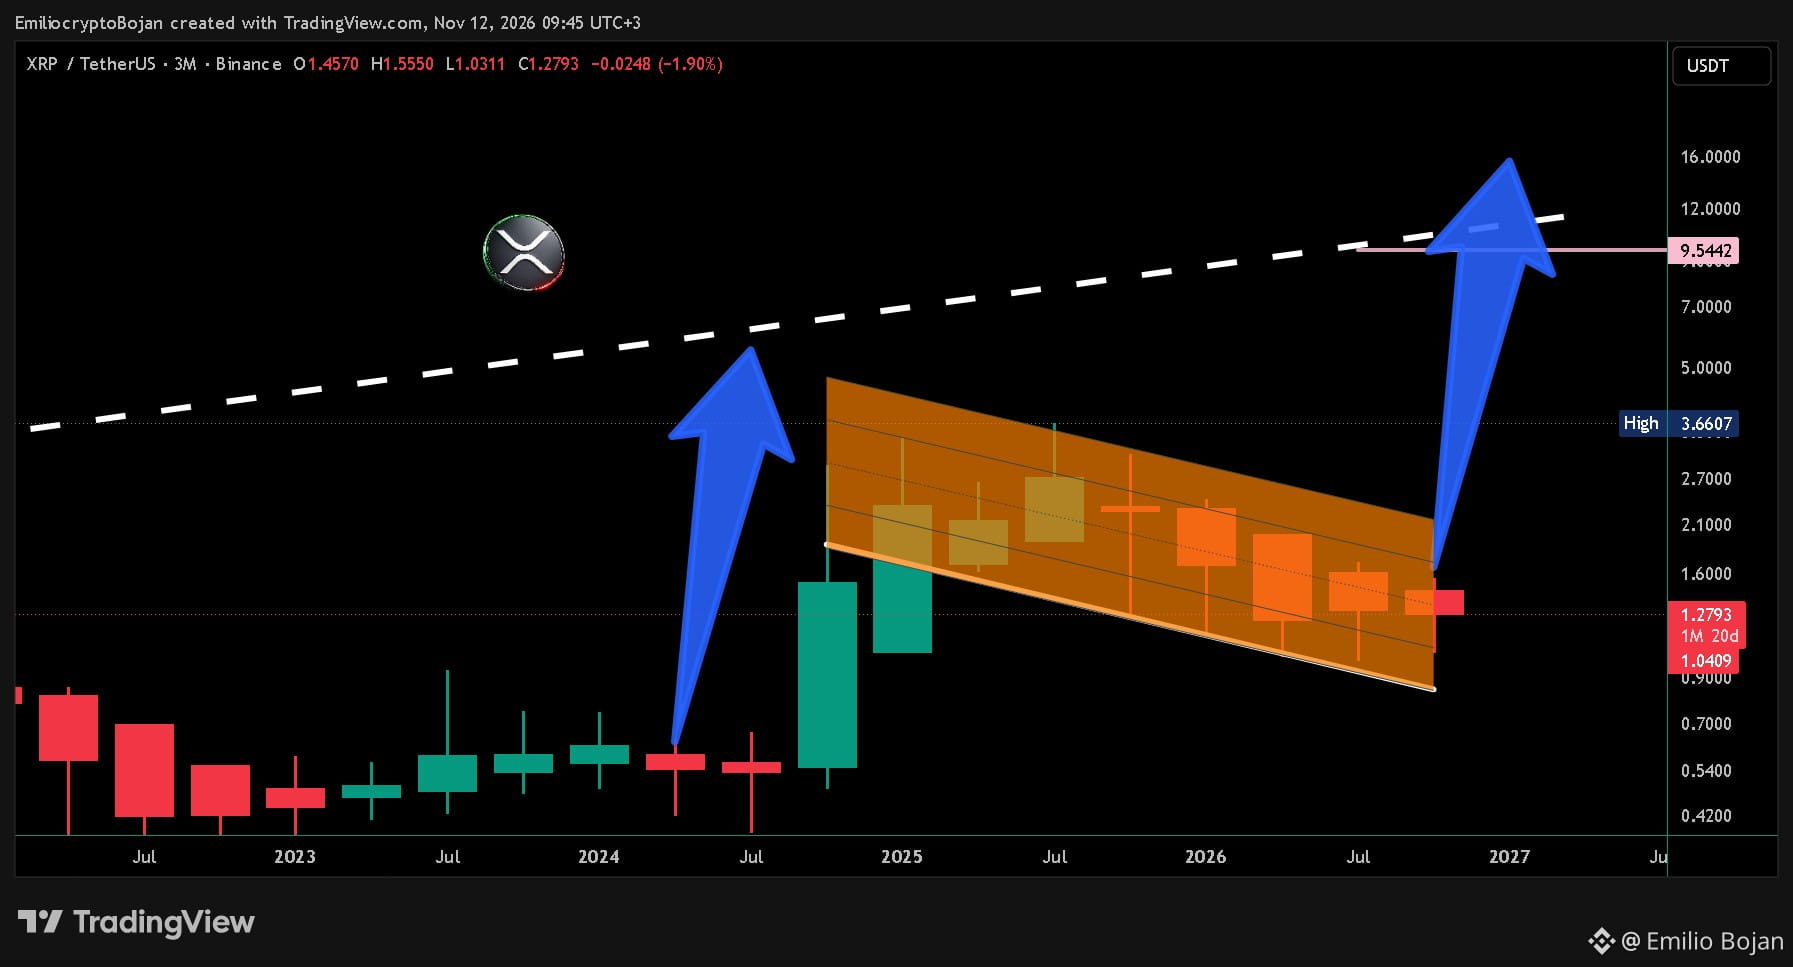
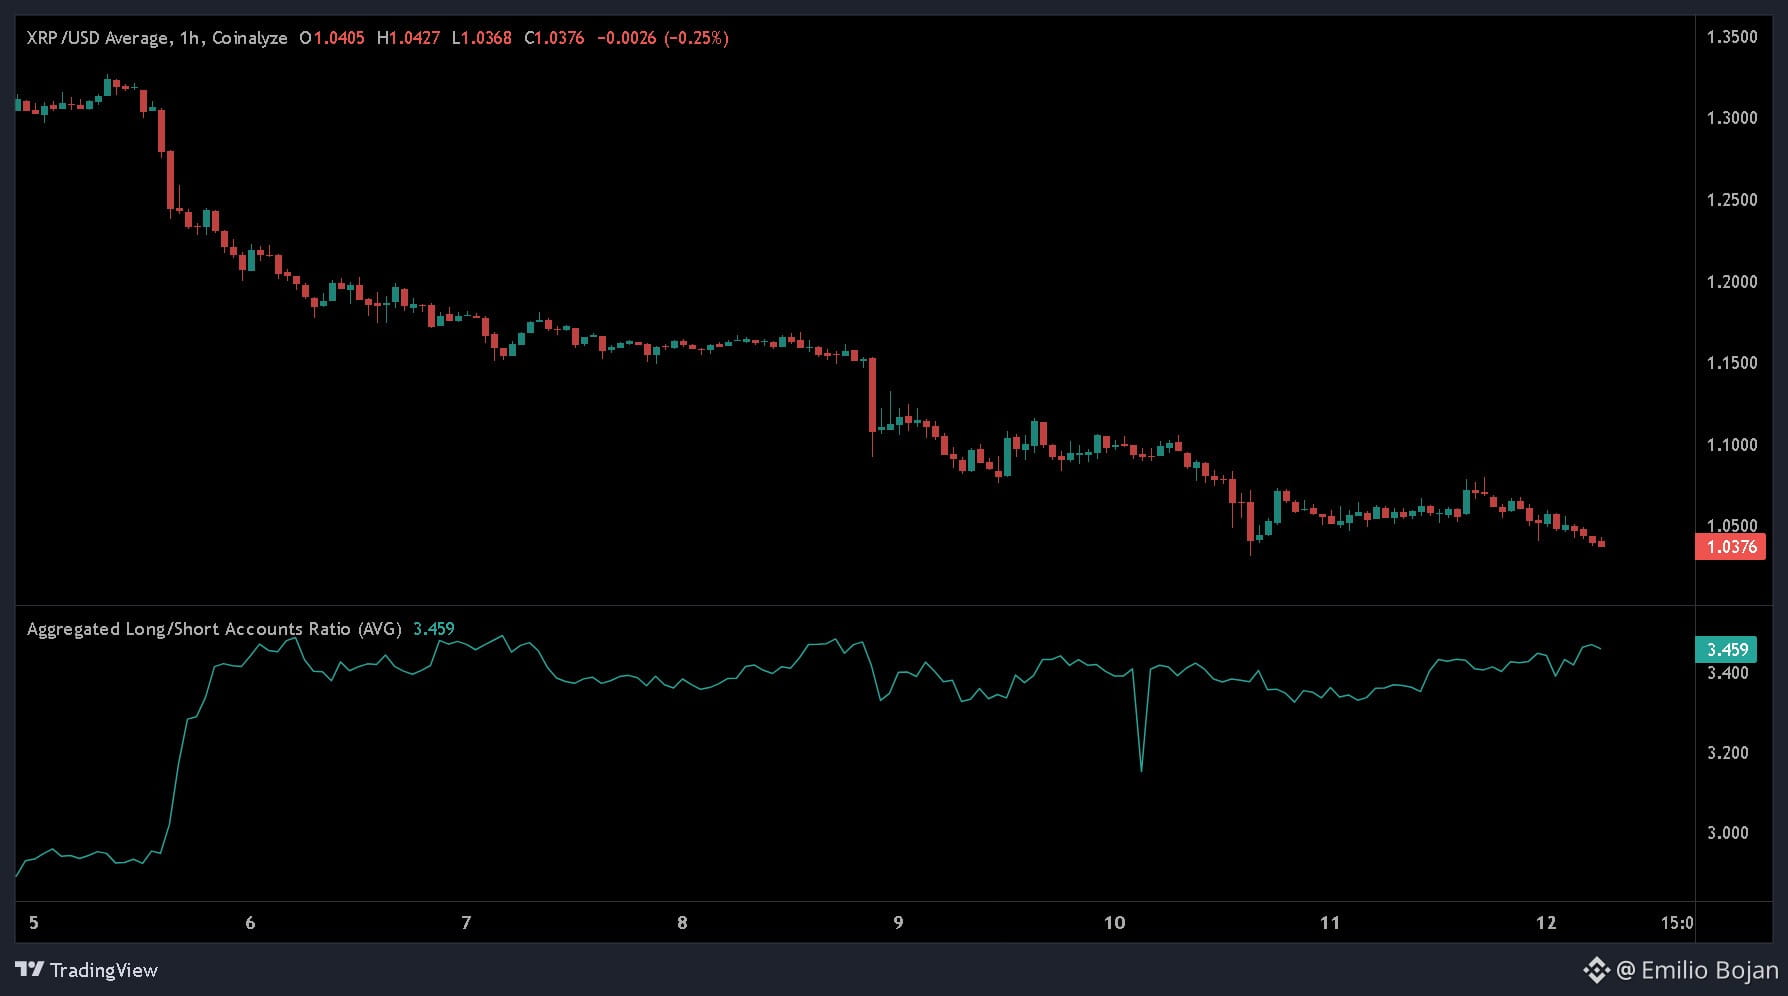
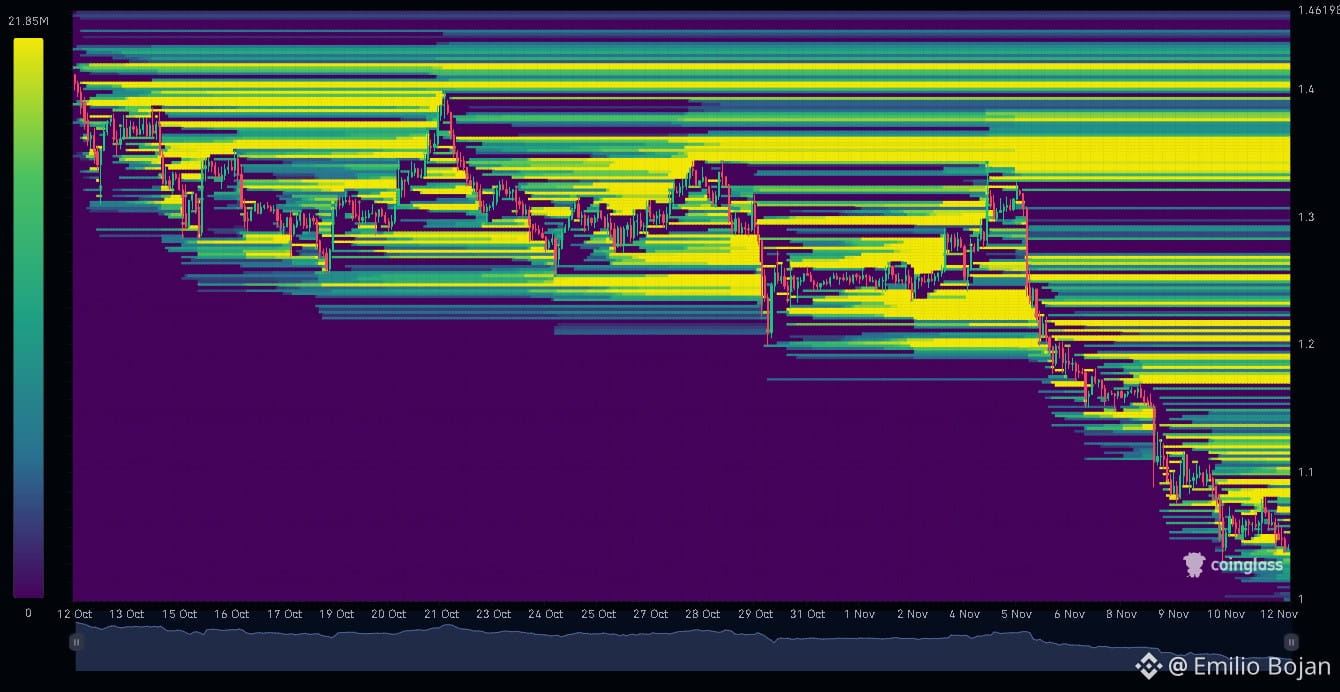
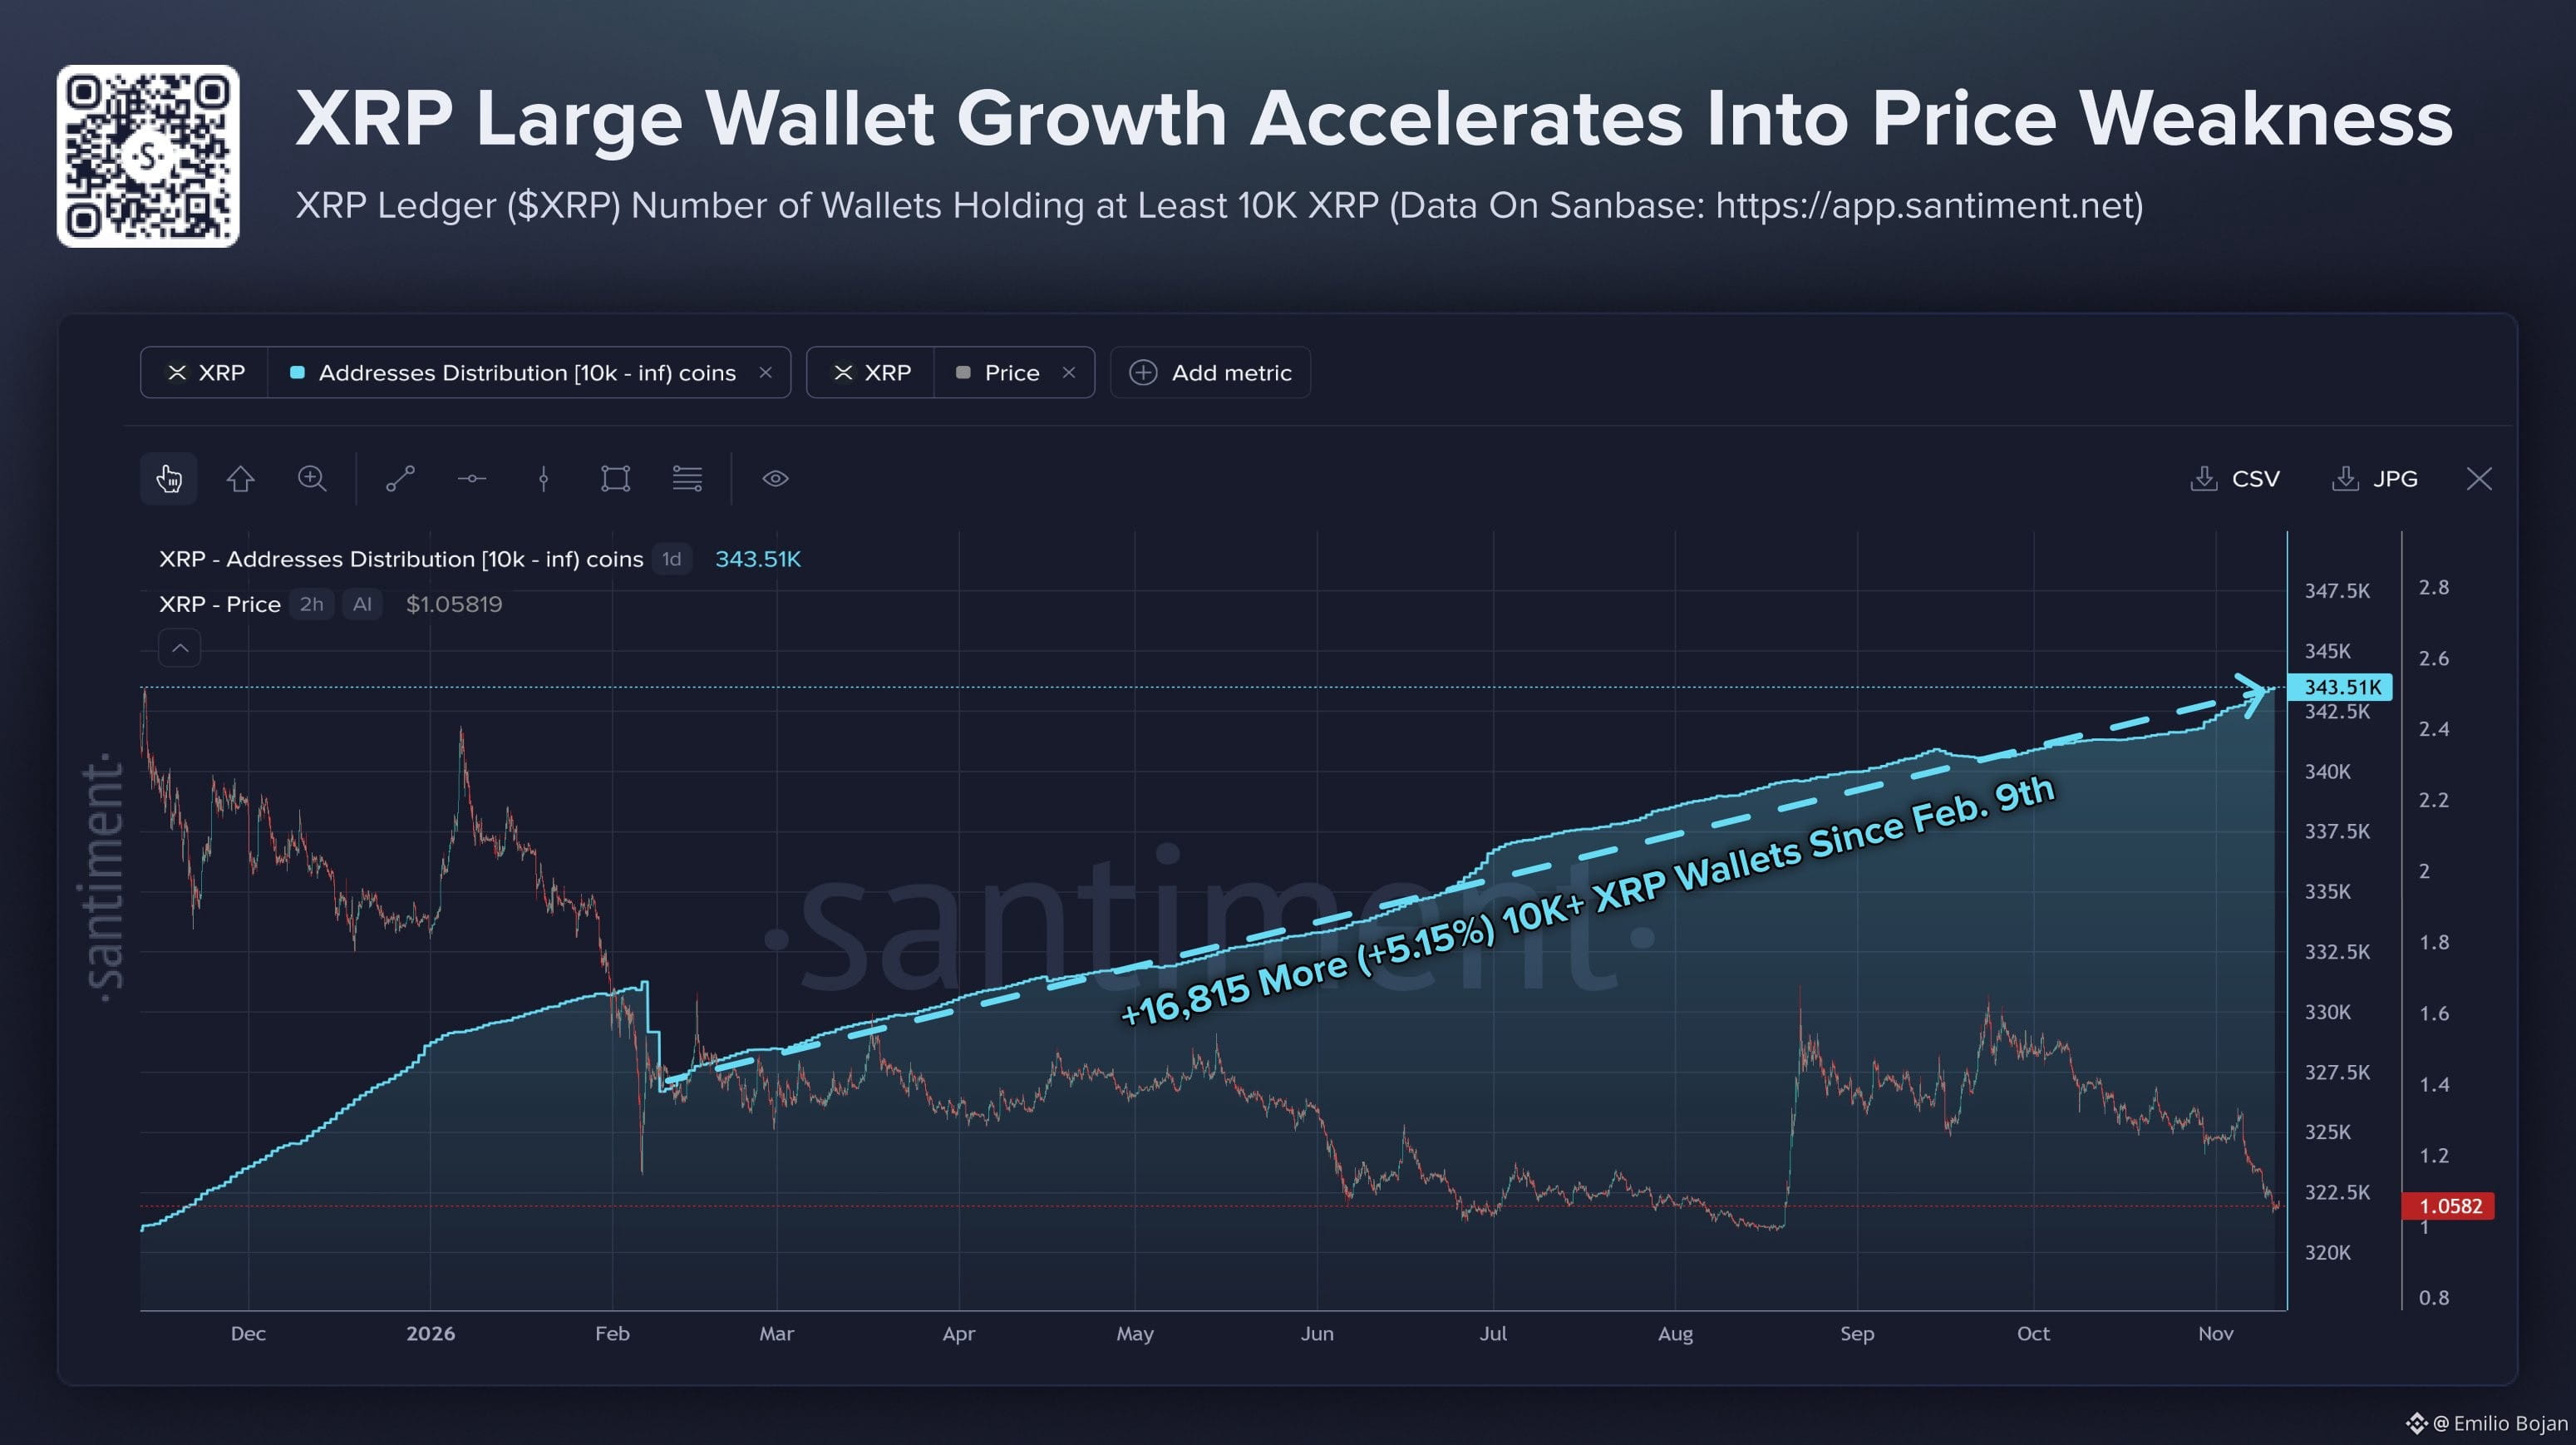
Something interesting is unfolding around $XRP . Multiple market metrics are beginning to align, suggesting we could be entering a new phase that we haven't seen in a long time. 👇 🐋 LIQUIDATION HEATMAP Across multiple timeframes, significant liquidity clusters are sitting ABOVE the current price. Interestingly, these clusters are positioned above the key levels we've been watching for XRP to reclaim before the next major bull run can begin. 📈LONG/SHORT RATIO XRP's Long/Short Ratio has crossed 3.435 for the first time since January 1, 2026. This is particularly interesting because we've seen a similar positioning pattern in 2024. Following that development, XRP went on to print new ATHs. History doesn't guarantee a repeat, but this is worth watching. THE 3-MONTH CHART This is where things get even more interesting. XRP's 3-month timeframe is showing a bullish flag formation, one of the more unusual long-term bullish structures. This puts XRP among my TOP 3 most bullish charts right now. 🐳 4. WHALES ARE ACCUMULATING Santiment data is revealing another encouraging development. XRP wallets holding at least 10K tokens have grown to approximately 343.5K, adding 16,815 wallets (+5.15%) in nine months. Meanwhile, XRP has dropped roughly 30% over the past seven weeks. Think about that: Price is falling, but larger holders continue to expand their positions. This divergence suggests that some bigger market participants could be using the fear to accumulate rather than exit. KEY LEVELS TO WATCH: $1.00 — Critical support to defend. $1.10–$1.15 — Potential recovery and reclaim zone. $9.544 — The major breakout gateway. A successful breakout above this level could open the door towards $100. 🎯 As whale accumulation continues, XRP holds $1, and Bitcoin stabilizes, a recovery could develop quickly. $1 has to hold. My bigger picture remains extremely bullish. $XRP to $1,500? That's my long-term moonshot vision. #XRPARMY #XRPUSDT #Altcoin Season#
Krypto-Nutzer weltweit auf Binance Square kennenlernen
⚡️ Bleib in Sachen Krypto stets am Puls.
💬 Die weltgrößte Kryptobörse vertraut darauf.
👍 Erhalte verlässliche Einblicke von verifizierten Creators.
E-Mail-Adresse/Telefonnummer