$BNB: Understanding Short Squeezes and Long Liquidations
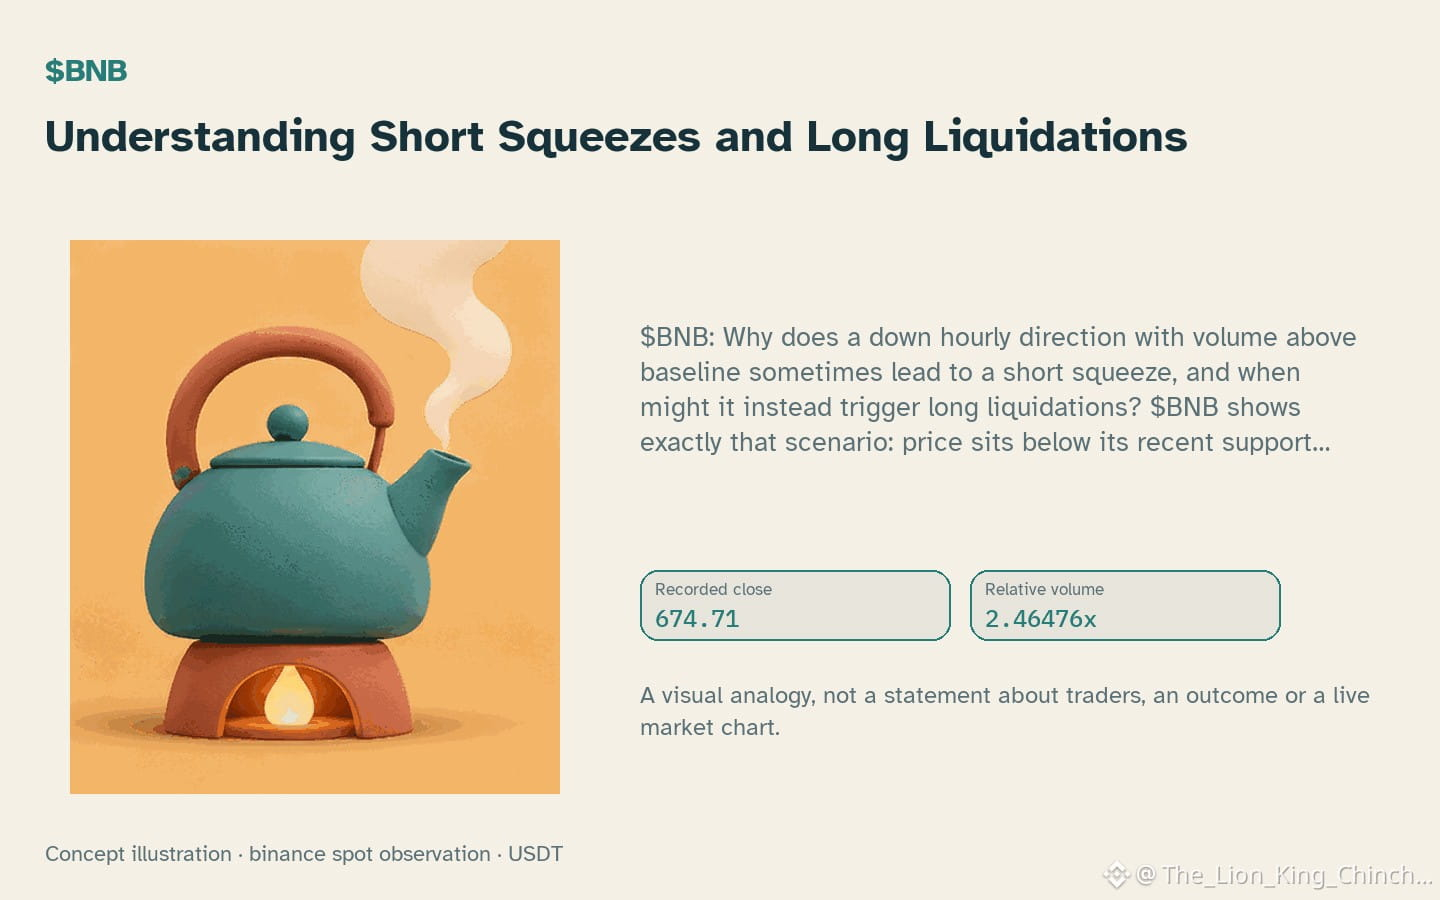
$BNB: Why does a down hourly direction with volume above baseline sometimes lead to a short squeeze, and when might it instead trigger long liquidations? $BNB shows exactly that scenario: price sits below its recent support while the hourly trend is down and the relative volume is 2.46x baseline.
**Myth**
A common misconception is that high volume automatically confirms a short squeeze. Traders often assume that strong buying pressure will push price sharply upward, ending a down move.
**Explanation**
Volume alone reflects how many contracts trade, not who is on the other side. If many short positions are already open near the support level, a modest buying surge can force those shorts to cover, creating a short squeeze. The mechanism works because covered shorts add buying pressure, amplifying the move. However, the same volume surge can also attract new long entries that are later liquidated if price continues downward, especially when leverage is high. The outcome depends on the existing position imbalance, not on volume alone.
**Counterexample**
If the market is already heavily long and the price breaks lower, the same volume spike may simply provide enough liquidity for long liquidations rather than a squeeze.
**Self‑Check**
Future hourly candles that show a decline despite continued volume above baseline would weaken the squeeze hypothesis and suggest liquidation risk instead.
**Next Observation**
Watch for a change in RSI 29.2 alongside the volume signal; a falling RSI while volume stays high could hint that long liquidation pressure is building.
Probabilistic market research, not a recommendation or guaranteed return.
A useful cross-check: $ETH has hourly direction down and volume above its baseline; $NIGHT has hourly direction down and volume above its baseline. This alone does not establish correlation.
#BNB #ETH
$BNB: Why does a down hourly direction with volume above baseline sometimes lead to a short squeeze, and when might it instead trigger long liquidations? $BNB shows exactly that scenario: price sits below its recent support while the hourly trend is down and the relative volume is 2.46x baseline.
**Myth**
A common misconception is that high volume automatically confirms a short squeeze. Traders often assume that strong buying pressure will push price sharply upward, ending a down move.
**Explanation**
Volume alone reflects how many contracts trade, not who is on the other side. If many short positions are already open near the support level, a modest buying surge can force those shorts to cover, creating a short squeeze. The mechanism works because covered shorts add buying pressure, amplifying the move. However, the same volume surge can also attract new long entries that are later liquidated if price continues downward, especially when leverage is high. The outcome depends on the existing position imbalance, not on volume alone.
**Counterexample**
If the market is already heavily long and the price breaks lower, the same volume spike may simply provide enough liquidity for long liquidations rather than a squeeze.
**Self‑Check**
Future hourly candles that show a decline despite continued volume above baseline would weaken the squeeze hypothesis and suggest liquidation risk instead.
**Next Observation**
Watch for a change in RSI 29.2 alongside the volume signal; a falling RSI while volume stays high could hint that long liquidation pressure is building.
Probabilistic market research, not a recommendation or guaranteed return.
A useful cross-check: $ETH has hourly direction down and volume above its baseline; $NIGHT has hourly direction down and volume above its baseline. This alone does not establish correlation.
#BNB #ETH