

Midnight (NIGHT) is attracting attention after gaining approximately 8.53%, but the bigger question is whether buyers have enough strength to push the price even higher.
At around $0.04656, NIGHT is approaching an important technical battle. The four-timeframe chart analysis reveals an interesting picture: the bigger trend looks bullish, but short-term momentum is showing signs of hesitation.
Let's break it down.
1. The 15-Minute Chart: A Short-Term Warning
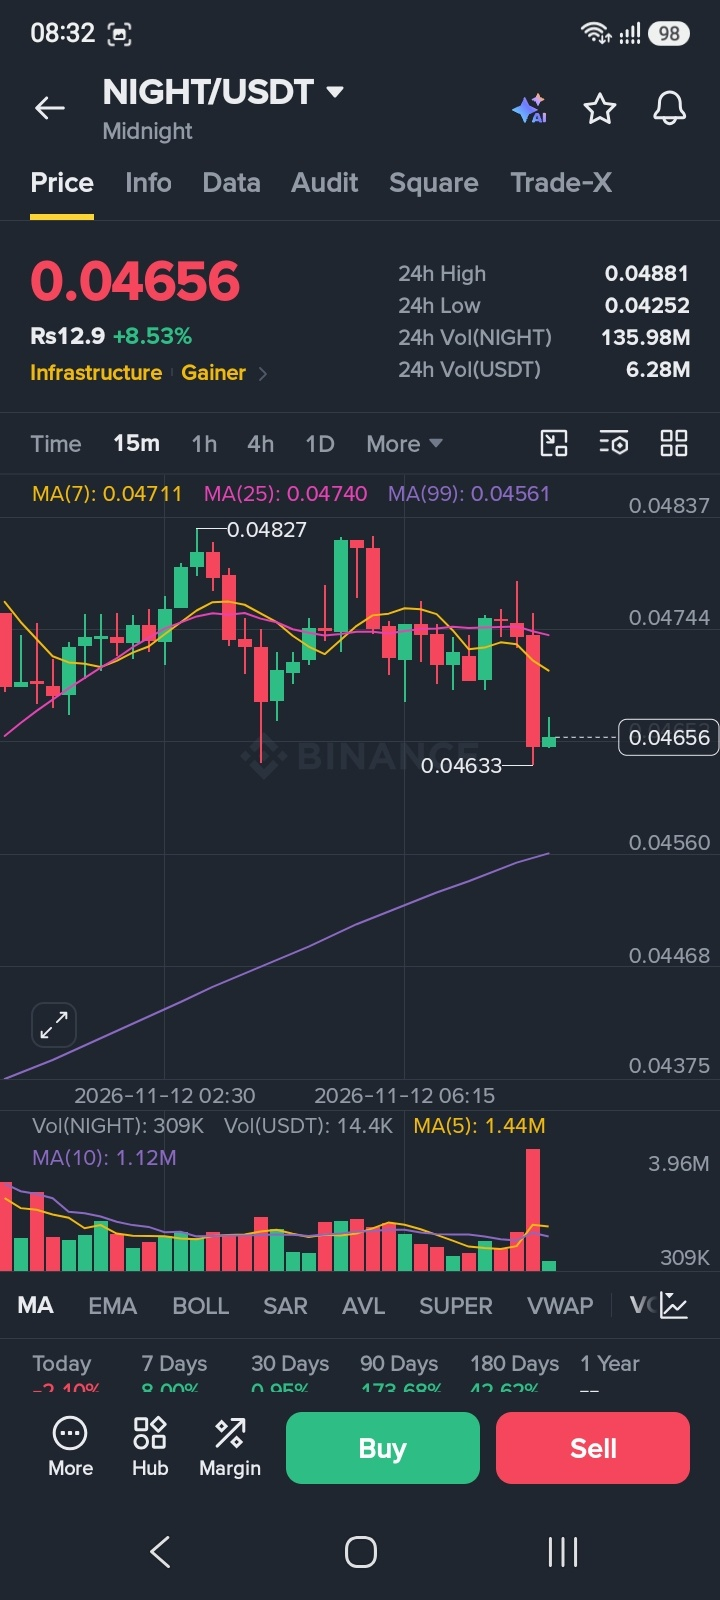
Price: $0.04656
MA(7): $0.04711
MA(25): $0.04740
MA(99): $0.04561
Candle volume: 309K
Volume MA(5): 1.44M
Volume MA(10): 1.12M
Price is below MA(7) and MA(25), showing short-term selling pressure. However, it remains above MA(99).
Volume is also significantly below its averages. A stronger recovery in buying activity is needed.
2. The 1-Hour Chart: Buyers Still Have an Advantage
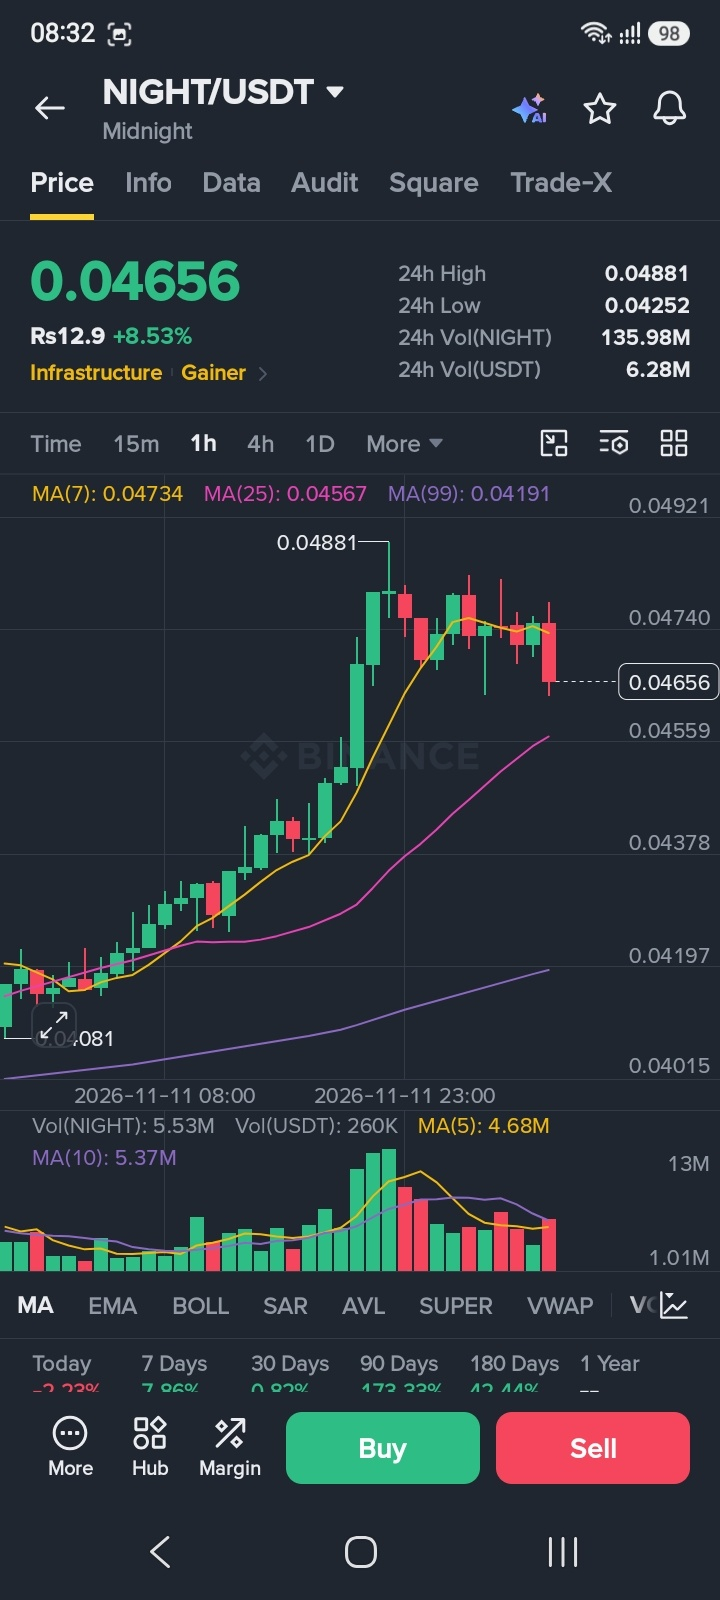
Price: $0.04656
MA(7): $0.04734
MA(25): $0.04567
MA(99): $0.04191
Candle volume: 5.53M
Volume MA(5): 4.68M
Volume MA(10): 5.37M
The hourly chart is mixed. Price is below MA(7), but remains above MA(25) and MA(99).
The encouraging part? Candle volume is above both volume averages, indicating stronger trading activity on this timeframe.
3. The 4-Hour Chart: The Strongest Bullish Signal
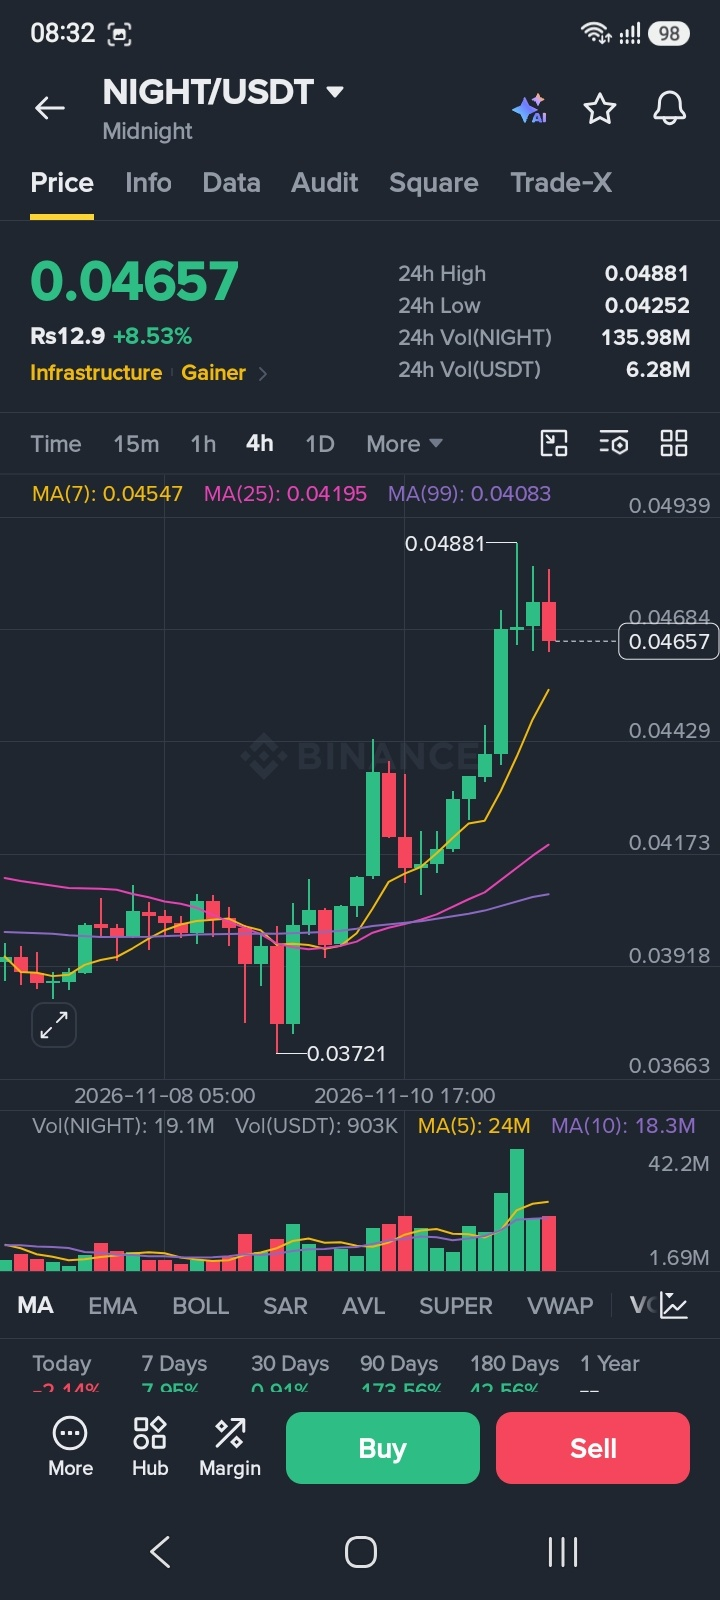
Price: $0.04657
MA(7): $0.04547
MA(25): $0.04195
MA(99): $0.04083
Candle volume: 19.1M
Volume MA(5): 24M
Volume MA(10): 18.3M
NIGHT is trading above all three moving averages.
This supports the bullish medium-term structure. However, volume is still below MA(5), so another strong wave of buying activity would make the recovery more convincing.
4. The Daily Chart: Bigger Trend Remains Positive
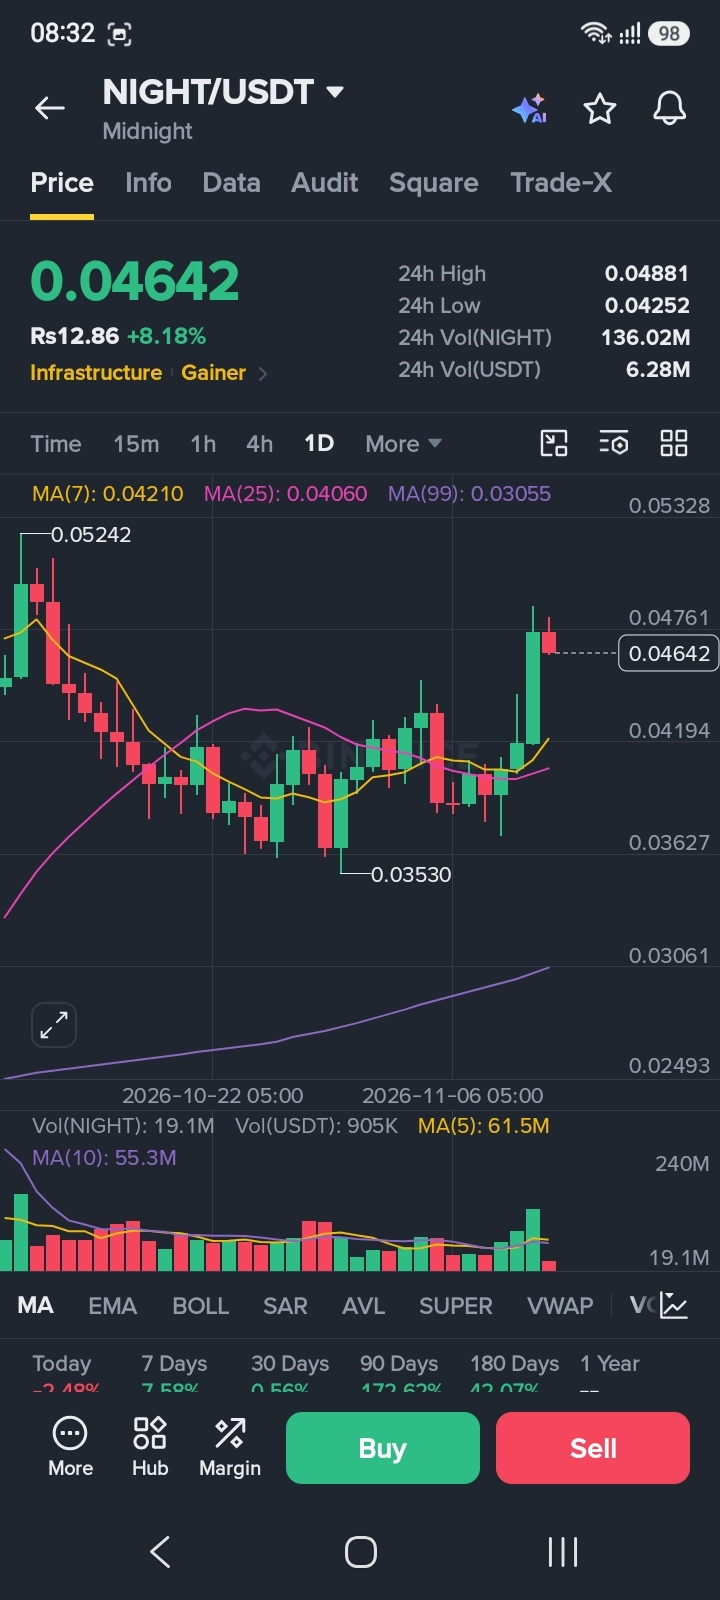
Price: $0.04642
MA(7): $0.04210
MA(25): $0.04060
MA(99): $0.03055
Candle volume: 19.1M
Volume MA(5): 61.5M
Volume MA(10): 55.3M
The daily chart shows a positive moving-average structure, with price above all three averages.
However, daily candle volume is below both volume averages. The price recovery is encouraging, but stronger daily participation is still needed.
The Levels That Could Decide NIGHT's Next Move
Resistance levels:
$0.04711–$0.04740
$0.04881 — the 24-hour high
$0.04939 — the next chart reference
Support levels:
$0.04561–$0.04567
$0.04547
$0.04252 — the 24-hour low
Two Possible Scenarios
Bullish scenario: If NIGHT reclaims $0.04740 and breaks $0.04881 with convincing volume, buyers could attempt to push toward the $0.04939 area.
Bearish scenario: If price loses the $0.04547–$0.04561 support zone, the current recovery could weaken, bringing $0.04252 back into focus.
Final Take: Is NIGHT Ready for Another Move?
The 4-hour and daily charts currently show a positive structure, while the 15-minute chart warns that short-term momentum has cooled.
The key level to watch is $0.04881. A convincing breakout with stronger volume could change the picture, but until then, caution remains important.
One question for the community:
Will NIGHT break above $0.04881, or will sellers defend this level once again?
Are you bullish on Midnight, or waiting for stronger confirmation?

Share your thoughts below!
Disclaimer: This article is for educational and informational purposes only. Analysis is based on the supplied Binance chart snapshots, not guaranteed live market data. It is not financial advice. Always do your own research and manage risk.
#NIGHT #Midnight #NIGHTUSDT #BinanceSquare #BinancePick #CryptoAnalysis #Altcoins #TechnicalAnalysis