⚡ $AXTIB — 20% SURGE! IS A BIGGER BREAKOUT APPROACHING? 🏆
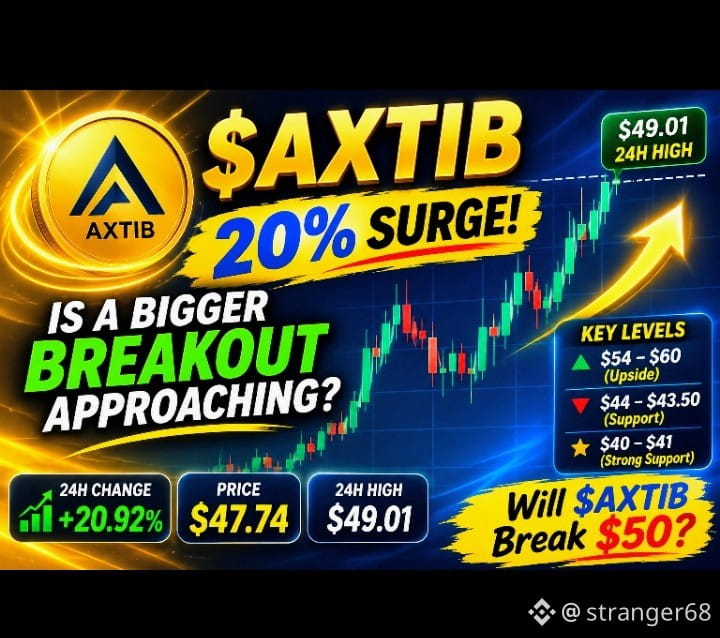
📈 AXTIB/USDT is heating up! Trading around $47.74, AXTIB has jumped 20.92% in 24 hours, getting close to its 24H high of $49.01. Buyers are showing strong momentum, but can they push the price higher? 💥
🔥 1H Chart: Price has made a powerful recovery from the $35.20 area and is now testing the $48–$49 zone. MA(7) at $48.05 is the immediate hurdle, while MA(25) at $43.56 and MA(99) at $40.86 provide support. 🛡️
🚀 4H Chart: The recovery is gaining strength, with price trading above MA(7) at $44.34 and MA(25) at $41.20. However, MA(99) near $49.20 remains an important resistance to overcome. A confirmed move above this level could strengthen the bullish outlook. 📊
🌅 1D Chart: A rebound from the $35.20 low is encouraging. Price has reclaimed the daily MA(7) at $40.41, but MA(25) around $50.74 is the next major challenge. A sustained recovery could open the door toward the $59–$60 region. 🎯
🎯 KEY LEVELS TO WATCH
- Resistance: $49.01 – $50.74
- Next upside zone: $54 – $60
- Support: $44 – $43.50
- Stronger support: $40 – $41
⚠️ My Take: AXTIB is showing impressive momentum across the short-term charts. However, holding above $44 and breaking through $49–$51 will be important. Watch for confirmation rather than chasing a sudden green candle. 🔍
💬 Do you think AXTIB can break above $50 and continue toward $60, or will sellers step in first? Share your view below! 🤝
#AXTIB #CryptoTrading #BinanceSquare
#AnthropicRejectsIPODelayValuationinQuestion #HotCPIDecemberHikePriced #CanNvidiaEarningsEaseMarketConcerns? #CoreWeaveJumps10%On168%RevenueGrowth
📈 AXTIB/USDT is heating up! Trading around $47.74, AXTIB has jumped 20.92% in 24 hours, getting close to its 24H high of $49.01. Buyers are showing strong momentum, but can they push the price higher? 💥
🔥 1H Chart: Price has made a powerful recovery from the $35.20 area and is now testing the $48–$49 zone. MA(7) at $48.05 is the immediate hurdle, while MA(25) at $43.56 and MA(99) at $40.86 provide support. 🛡️
🚀 4H Chart: The recovery is gaining strength, with price trading above MA(7) at $44.34 and MA(25) at $41.20. However, MA(99) near $49.20 remains an important resistance to overcome. A confirmed move above this level could strengthen the bullish outlook. 📊
🌅 1D Chart: A rebound from the $35.20 low is encouraging. Price has reclaimed the daily MA(7) at $40.41, but MA(25) around $50.74 is the next major challenge. A sustained recovery could open the door toward the $59–$60 region. 🎯
🎯 KEY LEVELS TO WATCH
- Resistance: $49.01 – $50.74
- Next upside zone: $54 – $60
- Support: $44 – $43.50
- Stronger support: $40 – $41
⚠️ My Take: AXTIB is showing impressive momentum across the short-term charts. However, holding above $44 and breaking through $49–$51 will be important. Watch for confirmation rather than chasing a sudden green candle. 🔍
💬 Do you think AXTIB can break above $50 and continue toward $60, or will sellers step in first? Share your view below! 🤝
#AXTIB #CryptoTrading #BinanceSquare
#AnthropicRejectsIPODelayValuationinQuestion #HotCPIDecemberHikePriced #CanNvidiaEarningsEaseMarketConcerns? #CoreWeaveJumps10%On168%RevenueGrowth