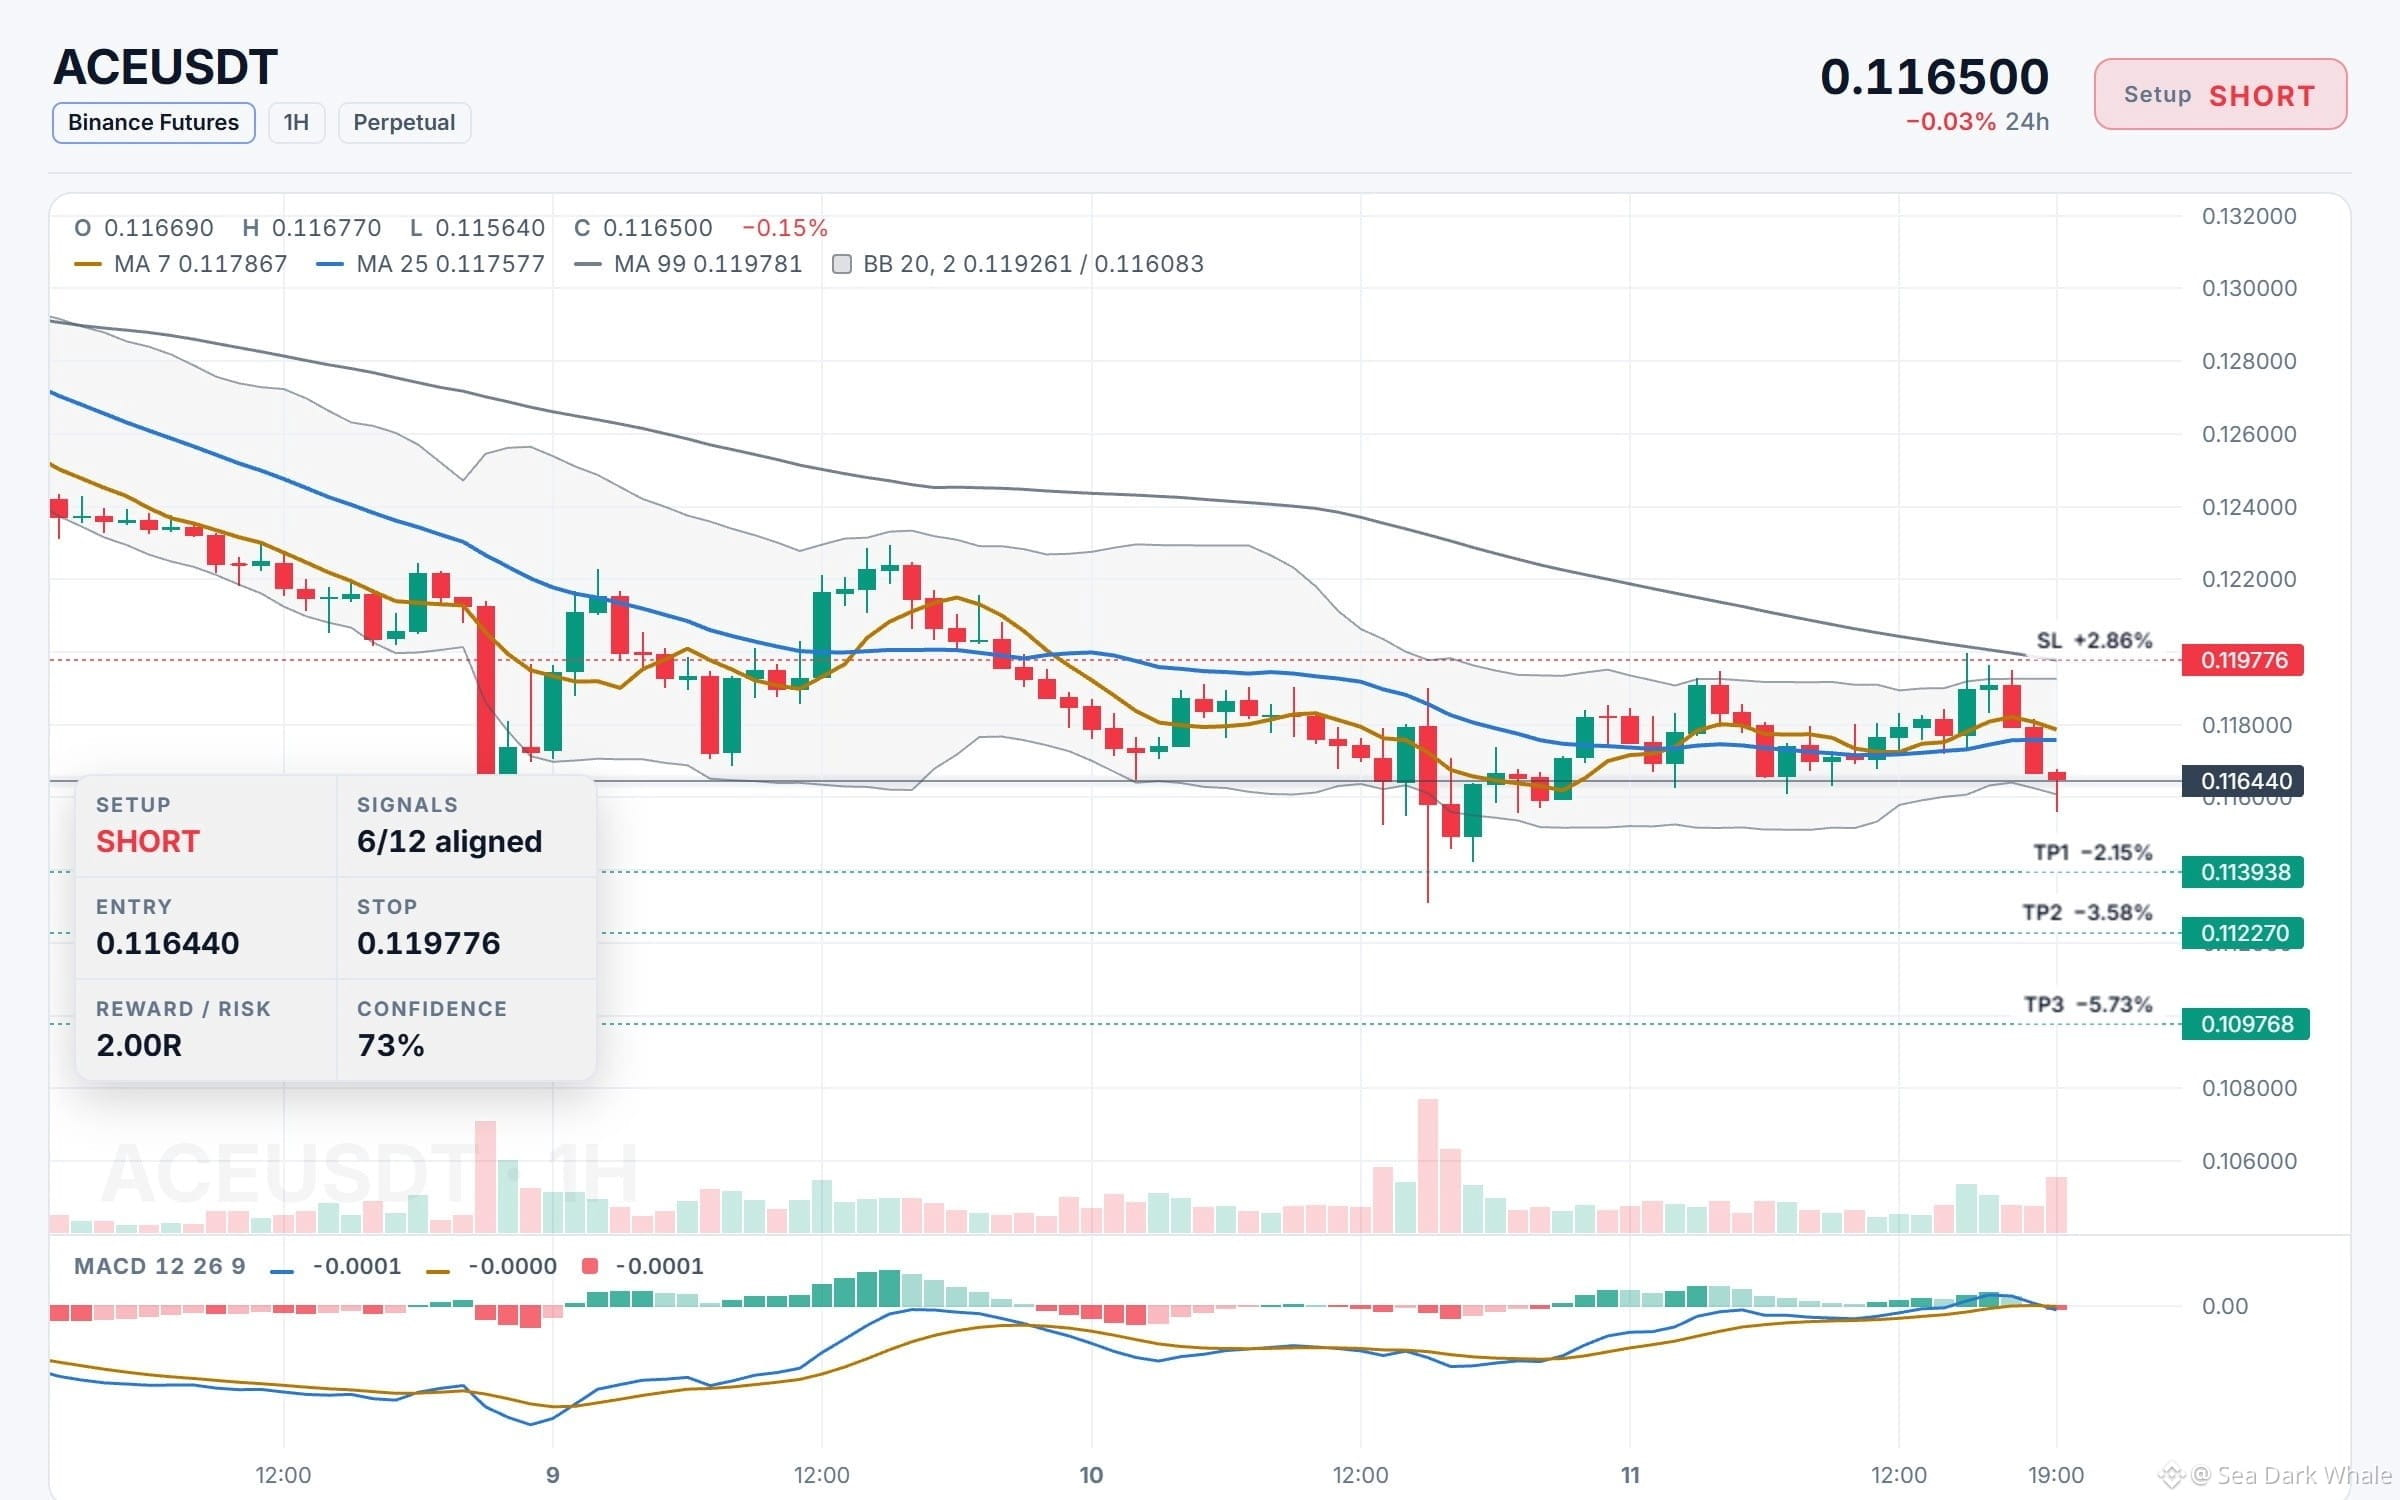
$ACE is setting up for a short with 2.00R on the table — the 4h EMA stack keeps pressing price lower, and the deepest target sits 5.7% under entry.
The case for the short is the trend itself: the 4h EMA stack points down, price is sitting below both EMA50 and EMA200, and the swing trend is down. Six of twelve signals are aligned behind the call, with 73% confidence on the setup.
Entry zone 0.116272–0.116608, chart entry 0.116440. Take profit 1 at 0.113938, down 2.1%; take profit 2 at 0.112270, down 3.6%; take profit 3 at 0.109768, down 5.7%. Stop loss at 0.119776, up 2.9%.
On the 1H chart, ACE/USDT perpetual last traded 0.116500, down 0.03% over 24 hours. The latest 1H candle printed open 0.116690, high 0.116770, low 0.115640, close 0.116500, down 0.15%. MA7 sits at 0.117867, MA25 at 0.117577, MA99 at 0.119781, with Bollinger Bands 20, 2 at 0.119261 / 0.116083. MACD 12, 26, 9 is flat around -0.0001. Chart as of 11 Nov 2026, 19:00 UTC.
Plan: close 50% at TP1, 25% at TP2 and 25% at TP3, and move the stop to entry once TP1 is hit.
Is the downside open from here, or does ACE find a floor first? Personal market analysis only, educational content, not investment advice — manage your risk and do your own research.
The case for the short is the trend itself: the 4h EMA stack points down, price is sitting below both EMA50 and EMA200, and the swing trend is down. Six of twelve signals are aligned behind the call, with 73% confidence on the setup.
Entry zone 0.116272–0.116608, chart entry 0.116440. Take profit 1 at 0.113938, down 2.1%; take profit 2 at 0.112270, down 3.6%; take profit 3 at 0.109768, down 5.7%. Stop loss at 0.119776, up 2.9%.
On the 1H chart, ACE/USDT perpetual last traded 0.116500, down 0.03% over 24 hours. The latest 1H candle printed open 0.116690, high 0.116770, low 0.115640, close 0.116500, down 0.15%. MA7 sits at 0.117867, MA25 at 0.117577, MA99 at 0.119781, with Bollinger Bands 20, 2 at 0.119261 / 0.116083. MACD 12, 26, 9 is flat around -0.0001. Chart as of 11 Nov 2026, 19:00 UTC.
Plan: close 50% at TP1, 25% at TP2 and 25% at TP3, and move the stop to entry once TP1 is hit.
Is the downside open from here, or does ACE find a floor first? Personal market analysis only, educational content, not investment advice — manage your risk and do your own research.