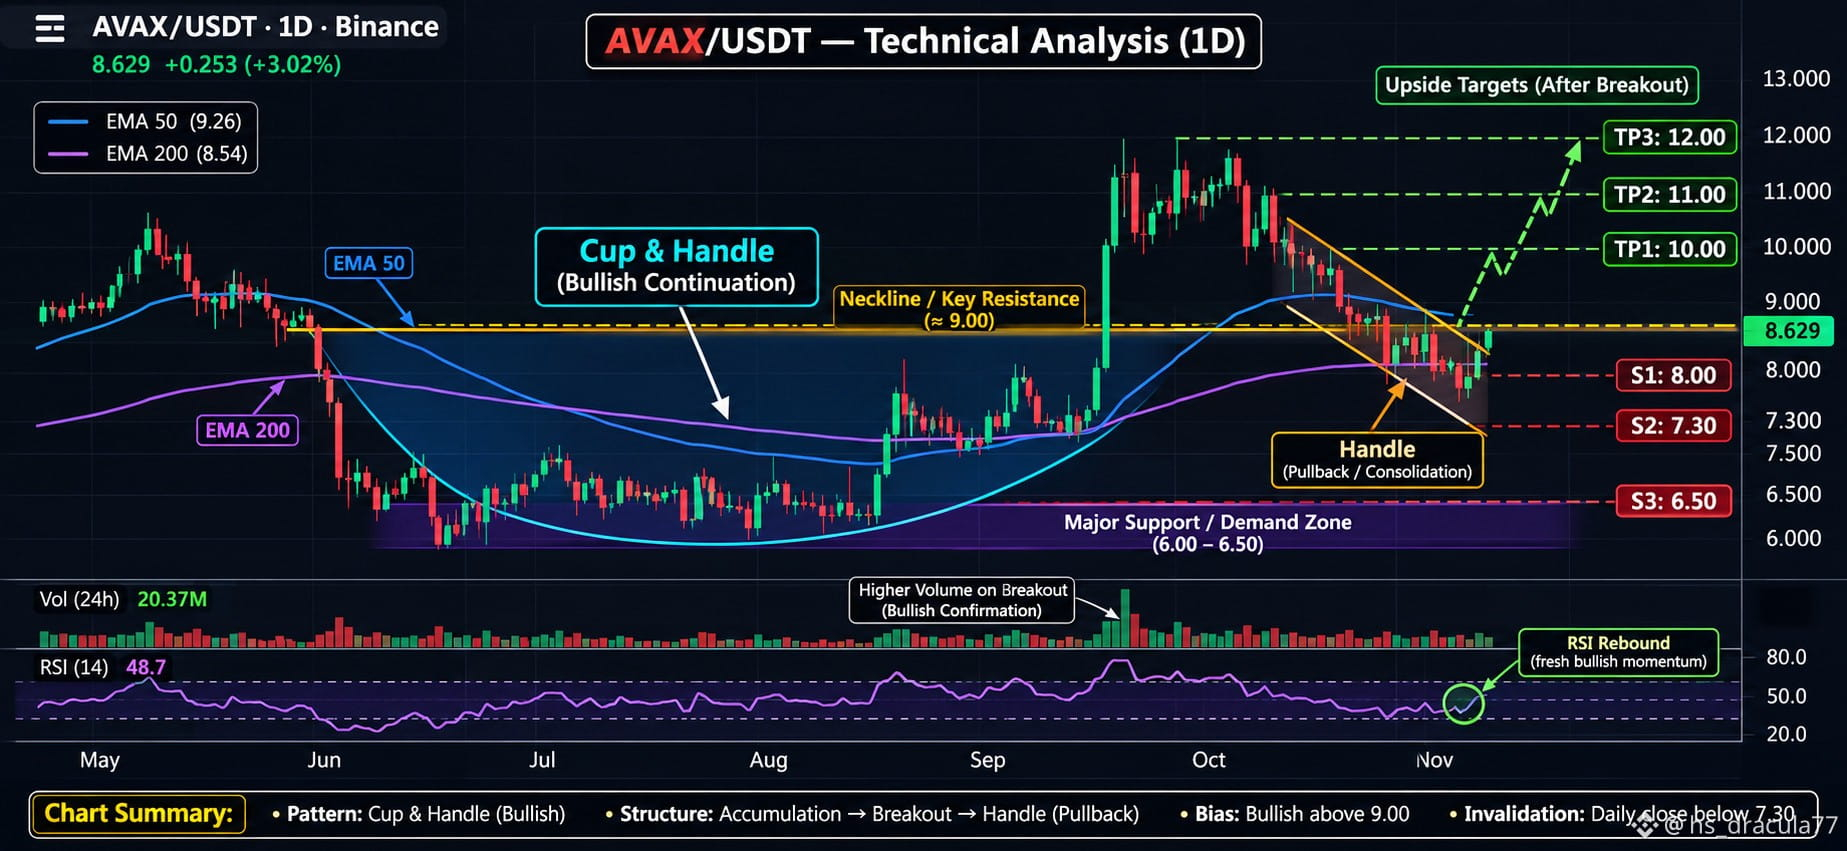
AVAX/USDT – 1D Technical Analysis
$AVAX Pattern identified: Cup & Handle structure with a bearish descending pullback (handle).
The chart is showing:
* Major structure: Accumulation → Bullish breakout → Pullback.
* Handle: Descending consolidation from the $11.5 region.
* Current price: $8.629.
Important levels of $AVAX
| Level | Price |
| --------------------------- | ----------- |
| Major resistance / neckline | $9.00 |
| Resistance 2 | $10.00 |
| Resistance 3 | $11.00 |
| Resistance 4 | $12.00 |
| Support 1 | $8.00 |
| Support 2 | $7.30 |
| Major demand zone | $6.00–$6.50 |
My trading view:
* A daily close above $9.00 could signal bullish recovery.
* A breakout above $10.00 would strengthen the bullish structure.
* Losing $8.00 could expose $7.30.
* Below $7.30, the bullish setup becomes significantly weaker.
Important: The Cup & Handle interpretation is a possible broader structure, not a confirmed textbook pattern. A breakout above $9.00 is still needed for confirmation. The original screenshot does not provide actual EMA or RSI data, so treat those indicators in the generated illustration as illustrative, not measured values.
#AVAXLegend #AVAXUSDT🚀 #Crypto_Jobs🎯
$AVAX Pattern identified: Cup & Handle structure with a bearish descending pullback (handle).
The chart is showing:
* Major structure: Accumulation → Bullish breakout → Pullback.
* Handle: Descending consolidation from the $11.5 region.
* Current price: $8.629.
Important levels of $AVAX
| Level | Price |
| --------------------------- | ----------- |
| Major resistance / neckline | $9.00 |
| Resistance 2 | $10.00 |
| Resistance 3 | $11.00 |
| Resistance 4 | $12.00 |
| Support 1 | $8.00 |
| Support 2 | $7.30 |
| Major demand zone | $6.00–$6.50 |
My trading view:
* A daily close above $9.00 could signal bullish recovery.
* A breakout above $10.00 would strengthen the bullish structure.
* Losing $8.00 could expose $7.30.
* Below $7.30, the bullish setup becomes significantly weaker.
Important: The Cup & Handle interpretation is a possible broader structure, not a confirmed textbook pattern. A breakout above $9.00 is still needed for confirmation. The original screenshot does not provide actual EMA or RSI data, so treat those indicators in the generated illustration as illustrative, not measured values.
#AVAXLegend #AVAXUSDT🚀 #Crypto_Jobs🎯