
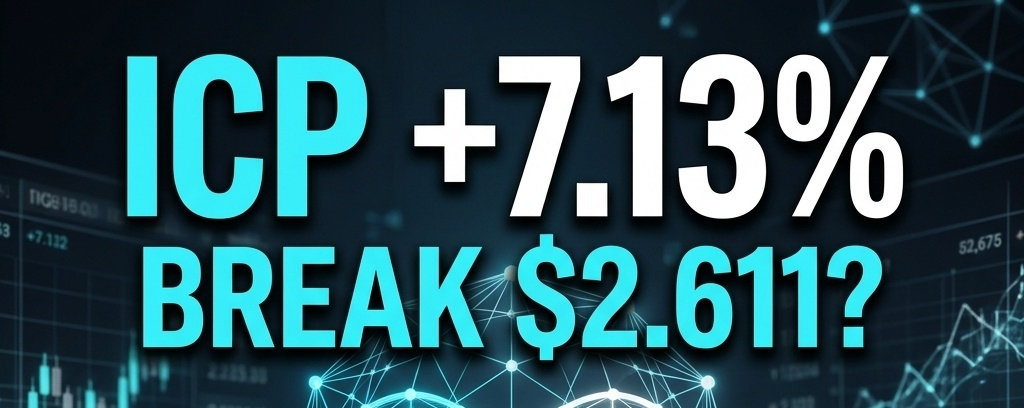

Internet Computer (ICP) is showing a promising recovery, trading around $2.601, up approximately 7.13% in the 24-hour snapshot.
But here is the important question: Is this the beginning of a stronger bullish move, or will buyers struggle near the $2.611 resistance?
Let's examine all four Binance chart timeframes.
1. 15-Minute Chart: Short-Term Buyers Have Control
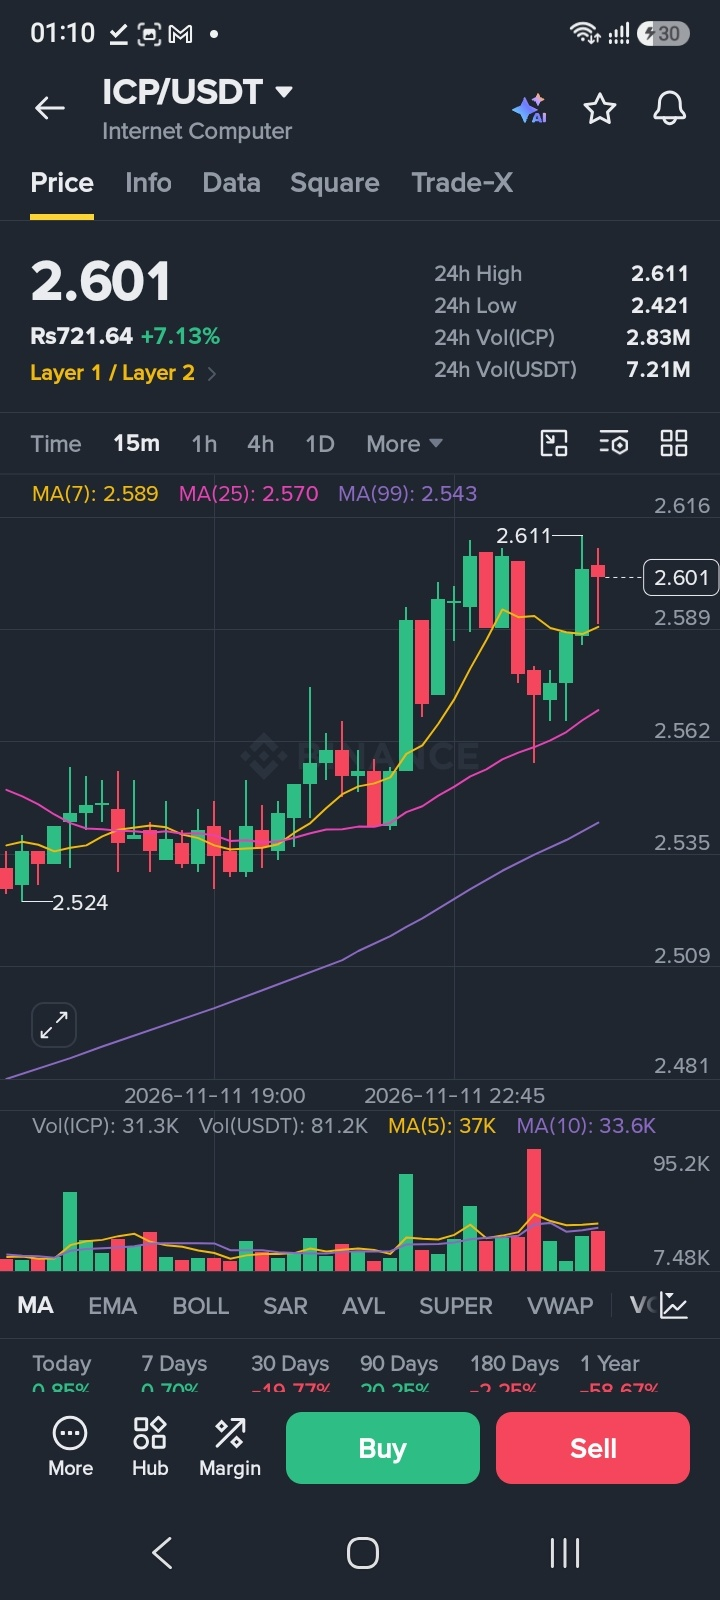
Price: $2.601
MA(7): $2.589
MA(25): $2.570
MA(99): $2.543
Candle volume: 31.3K ICP
Volume MA(5): 37K
Volume MA(10): 33.6K
Price is above all three moving averages, suggesting positive short-term momentum. However, candle volume is below both volume averages. Buyers are present, but stronger participation is needed to support a convincing breakout.
2. 1-Hour Chart: Recovery Structure Looks Stronger
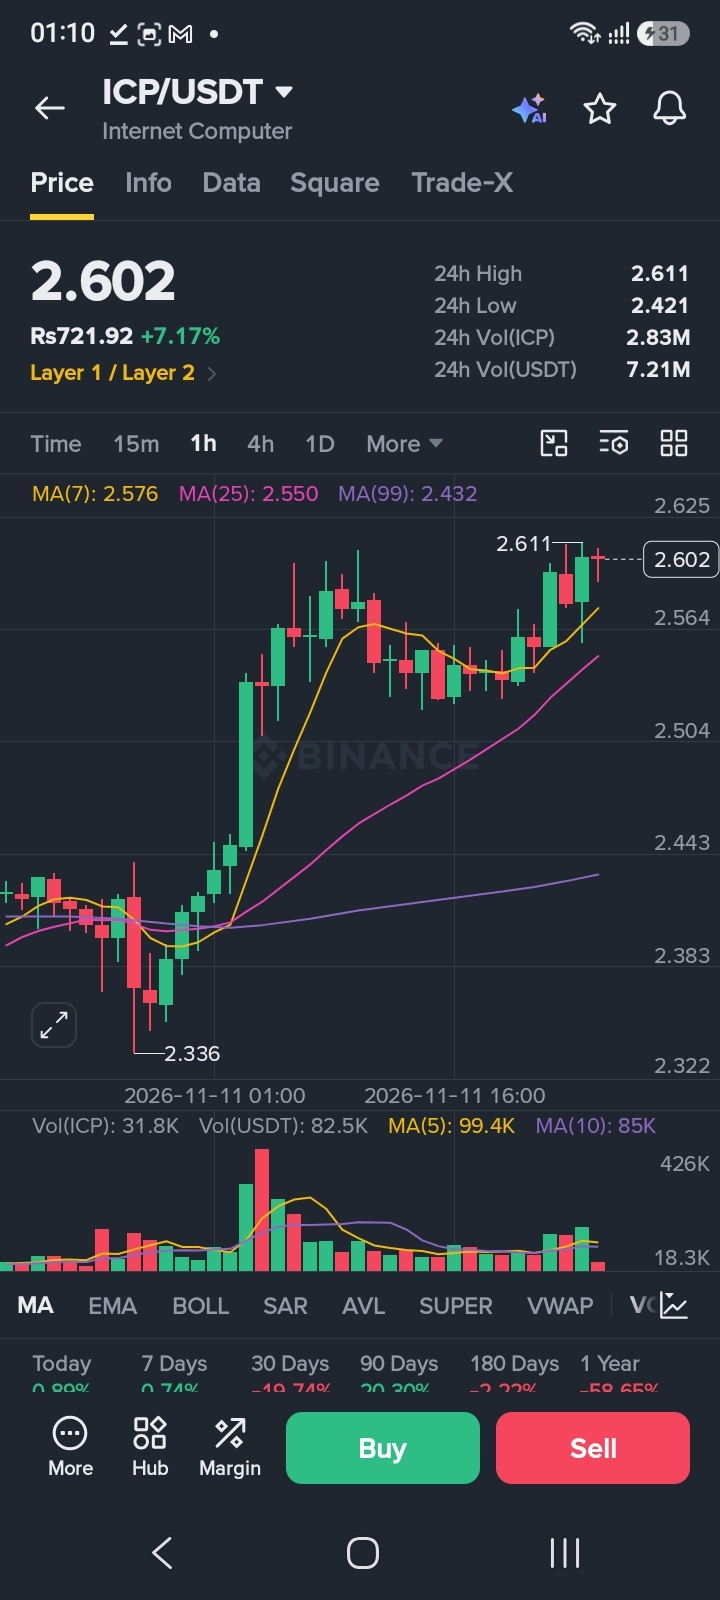
Price: $2.602
MA(7): $2.576
MA(25): $2.550
MA(99): $2.432
Candle volume: 31.8K ICP
Volume MA(5): 99.4K
Volume MA(10): 85K
ICP is trading above all three moving averages on the hourly chart. This is a positive technical signal.
However, the current candle volume is considerably lower than both volume averages. The price structure looks encouraging, but volume confirmation remains important.
3. 4-Hour Chart: Bullish Alignment, Weak Candle Volume
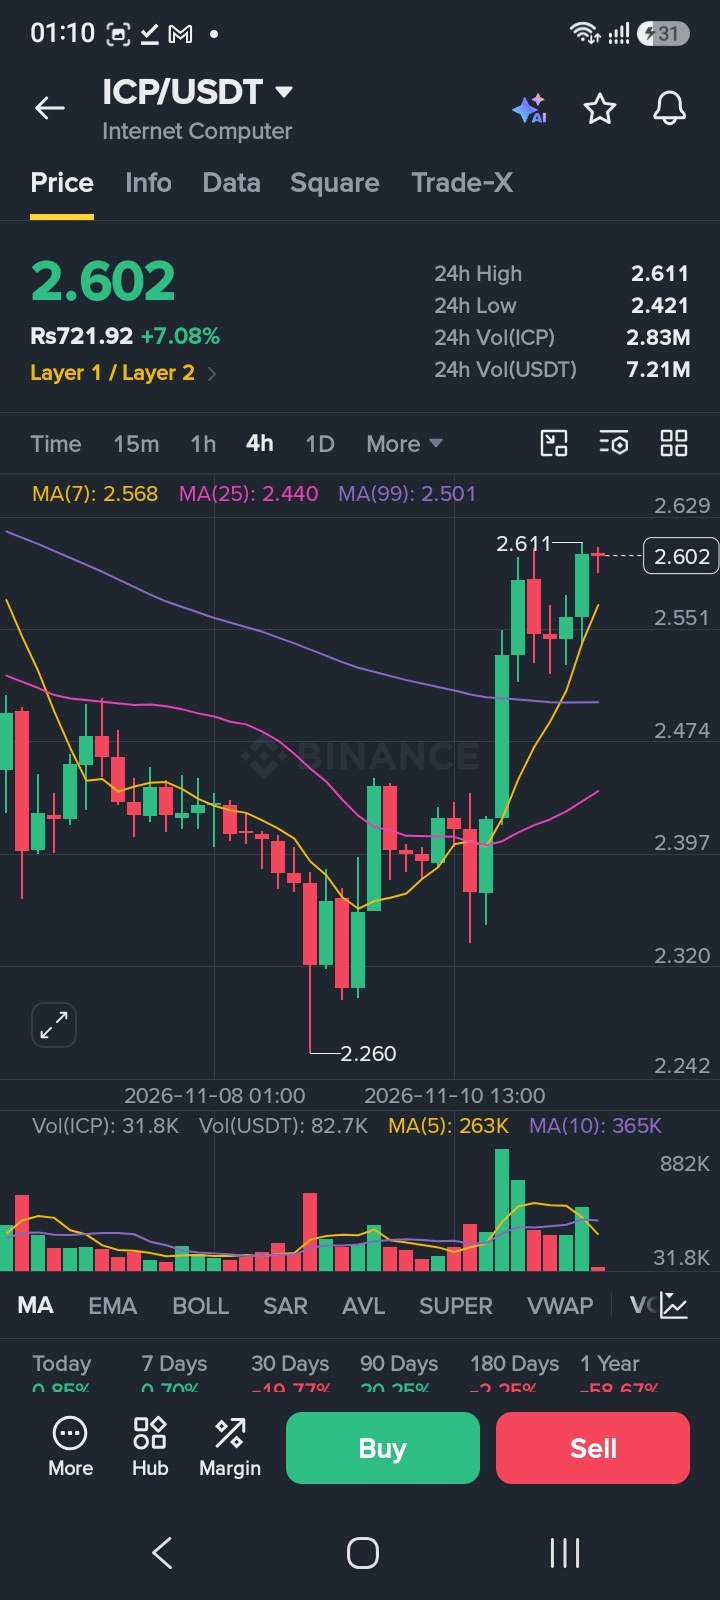
Price: $2.602
MA(7): $2.568
MA(25): $2.440
MA(99): $2.501
Candle volume: 31.8K ICP
Volume MA(5): 263K
Volume MA(10): 365K
The price is above all three moving averages, which supports the recovery argument.
But the current candle volume is far below its recent averages. This means the bullish structure still needs stronger participation before we can confidently call it a sustained breakout.
4. Daily Chart: Recovery Against a Bigger Resistance
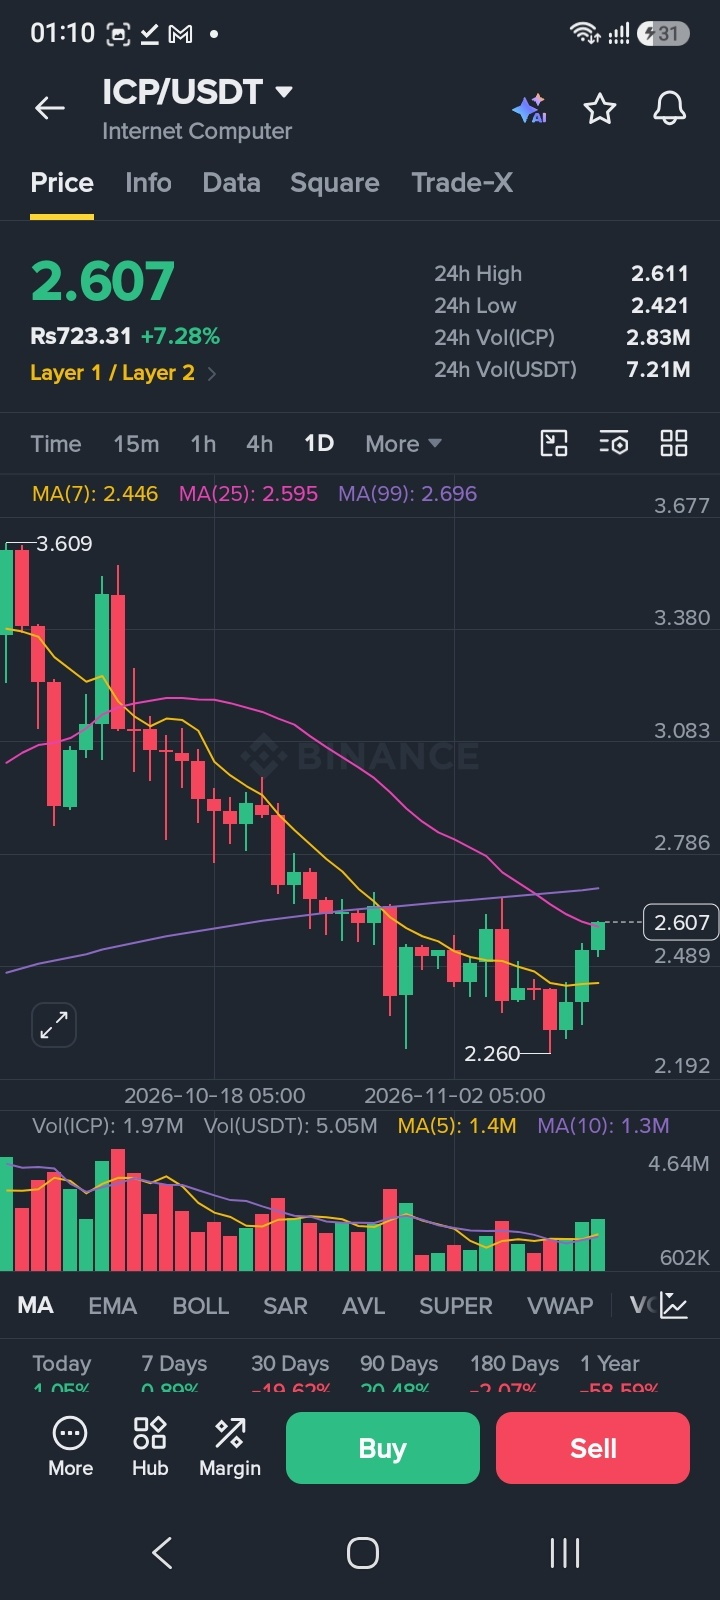
Price: $2.607
MA(7): $2.446
MA(25): $2.595
MA(99): $2.696
Candle volume: 1.97M ICP
Volume MA(5): 1.4M
Volume MA(10): 1.3M
The daily chart provides an interesting picture.
ICP is above MA(7) and slightly above MA(25), while daily volume is higher than both volume averages. This suggests stronger activity behind the recent recovery.
However, MA(99) at $2.696 remains an important overhead resistance area. The broader recovery is improving, but the daily trend has not cleared every major hurdle.
Key Support and Resistance Levels
Resistance levels to watch:
$2.611 — immediate 24-hour high and breakout test
$2.696 — daily MA(99), an important higher resistance
Support levels to watch:
$2.595–$2.589 — daily MA(25) and 15-minute MA(7) area
$2.576–$2.550 — hourly moving-average support zone
$2.543–$2.501 — lower short-term and 4-hour MA support area
$2.446–$2.421 — deeper support zone and 24-hour low area
These are reference levels from the supplied chart snapshots, not guaranteed turning points.
What Could Happen Next?
Bullish scenario: If ICP breaks above $2.611 with stronger volume and holds that level, buyers may attempt to challenge the $2.696 daily MA(99) resistance.
Bearish scenario: If price repeatedly fails near $2.611 and loses the $2.589–$2.595 support area, a deeper pullback toward $2.576 and $2.550 could become possible.
Final Verdict
ICP's short-term technical picture is encouraging: price is above all three moving averages on the 15-minute, 1-hour and 4-hour charts.
The daily chart also shows improving strength, supported by above-average volume. Still, lower-timeframe volume remains relatively weak, and the $2.611 resistance has not yet been convincingly cleared.
The next major question is simple: Can buyers turn $2.611 into support, or will this recovery lose momentum?
What do you think — will ICP break $2.611 and move toward $2.696, or face another rejection?
Share your view below.
Disclaimer: This article is for educational and informational purposes only. It is based on the chart snapshots supplied and does not constitute financial advice. Cryptocurrency markets are volatile; always do your own research and manage risk.
#ICP #InternetComputer #ICPUSDT #BinanceSquare #BinancePick #CryptoAnalysis #TechnicalAnalysis #altcoins