$SPCXB : Myth: ‘More Volume Always Means Bullish Accumulation’
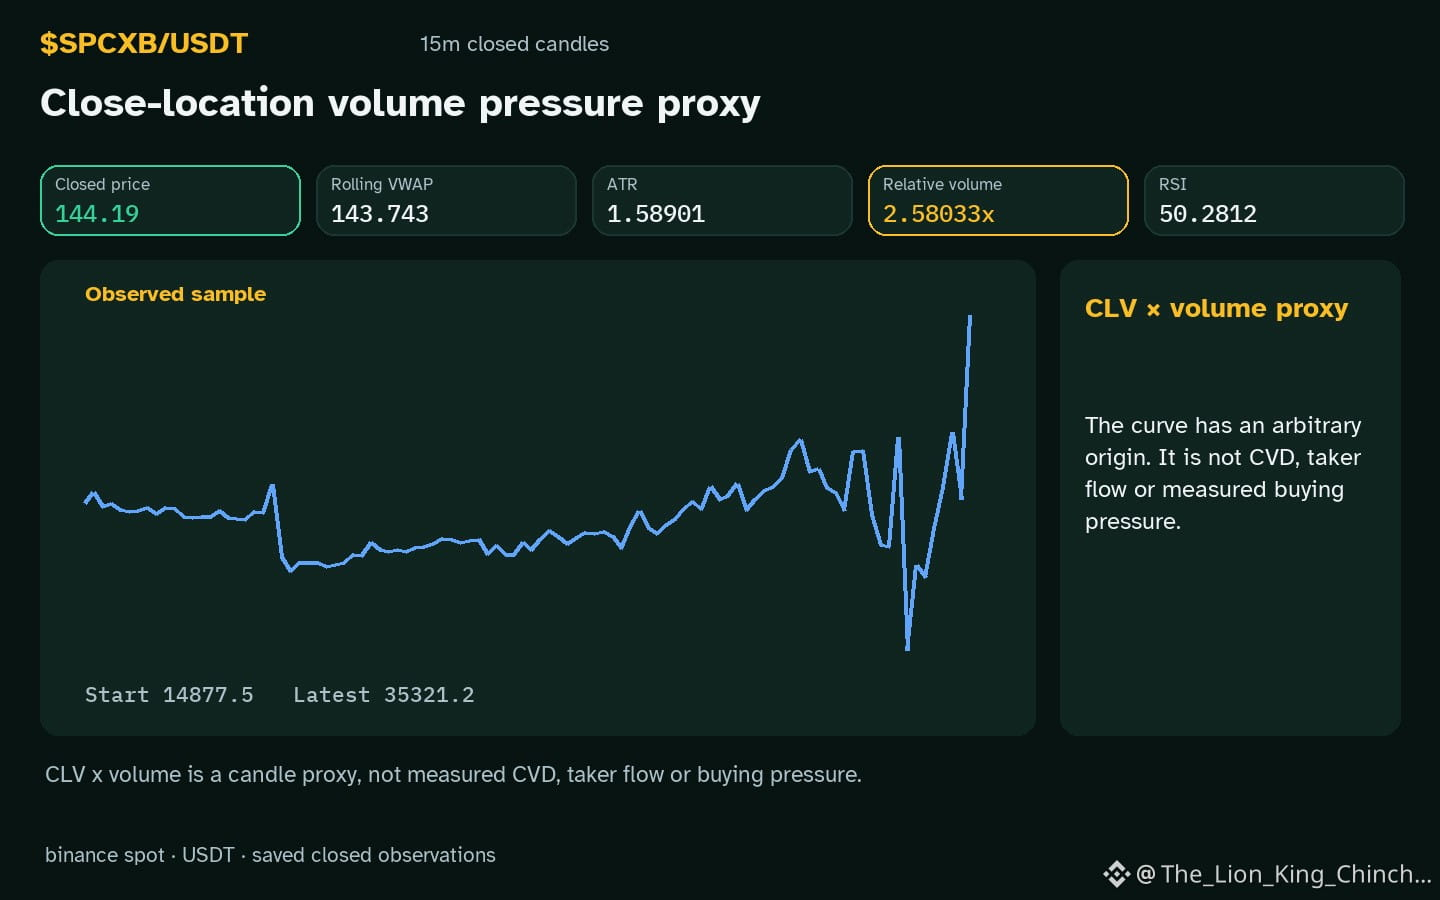
$SPCXB ’s hourly chart shows an upward direction and volume above its baseline, a scenario that can tempt a researcher to assume accumulation. Yet the observation is limited to a single candle: the price remains inside the recorded range and the RSI displays 50.3. In a hypothetical research habit, I often jot down a quick note, then later realize I’ve over‑interpreted a momentary spike.
The one‑way volume myth suggests that higher volume confirms a trend. However, volume alone does not reveal whether buyers or sellers dominate. The candle’s relative volume of 2.58x baseline could arise from a surge in liquidity or from a handful of large orders. Without corroborating signals. such as a sustained directional change, a breakout beyond support or resistance, or a shift in the moving‑average cross. the volume increase is merely a symptom.
A counterexample appears in $ETH, where an up hourly direction occurs while volume stays below baseline; here the price also lingers within its range and RSI remains neutral. This shows that direction alone does not dictate volume.
A useful lesson: reassess after the next candle. If volume stays elevated, the price moves beyond the prior range, and RSI tilts higher, the hypothesis gains weight. Otherwise, the spike was likely transient, and the rule should be revised.
Probabilistic market research, not a recommendation or guaranteed return.
The comparison to keep in mind: $ETH has hourly direction up and volume not above its baseline; $SNXXB has hourly direction up and volume above its baseline. This alone does not establish correlation.
Have you changed the rule after seeing the candle?
#SPCXB #ETH #SNXXB
$SPCXB ’s hourly chart shows an upward direction and volume above its baseline, a scenario that can tempt a researcher to assume accumulation. Yet the observation is limited to a single candle: the price remains inside the recorded range and the RSI displays 50.3. In a hypothetical research habit, I often jot down a quick note, then later realize I’ve over‑interpreted a momentary spike.
The one‑way volume myth suggests that higher volume confirms a trend. However, volume alone does not reveal whether buyers or sellers dominate. The candle’s relative volume of 2.58x baseline could arise from a surge in liquidity or from a handful of large orders. Without corroborating signals. such as a sustained directional change, a breakout beyond support or resistance, or a shift in the moving‑average cross. the volume increase is merely a symptom.
A counterexample appears in $ETH, where an up hourly direction occurs while volume stays below baseline; here the price also lingers within its range and RSI remains neutral. This shows that direction alone does not dictate volume.
A useful lesson: reassess after the next candle. If volume stays elevated, the price moves beyond the prior range, and RSI tilts higher, the hypothesis gains weight. Otherwise, the spike was likely transient, and the rule should be revised.
Probabilistic market research, not a recommendation or guaranteed return.
The comparison to keep in mind: $ETH has hourly direction up and volume not above its baseline; $SNXXB has hourly direction up and volume above its baseline. This alone does not establish correlation.
Have you changed the rule after seeing the candle?
#SPCXB #ETH #SNXXB