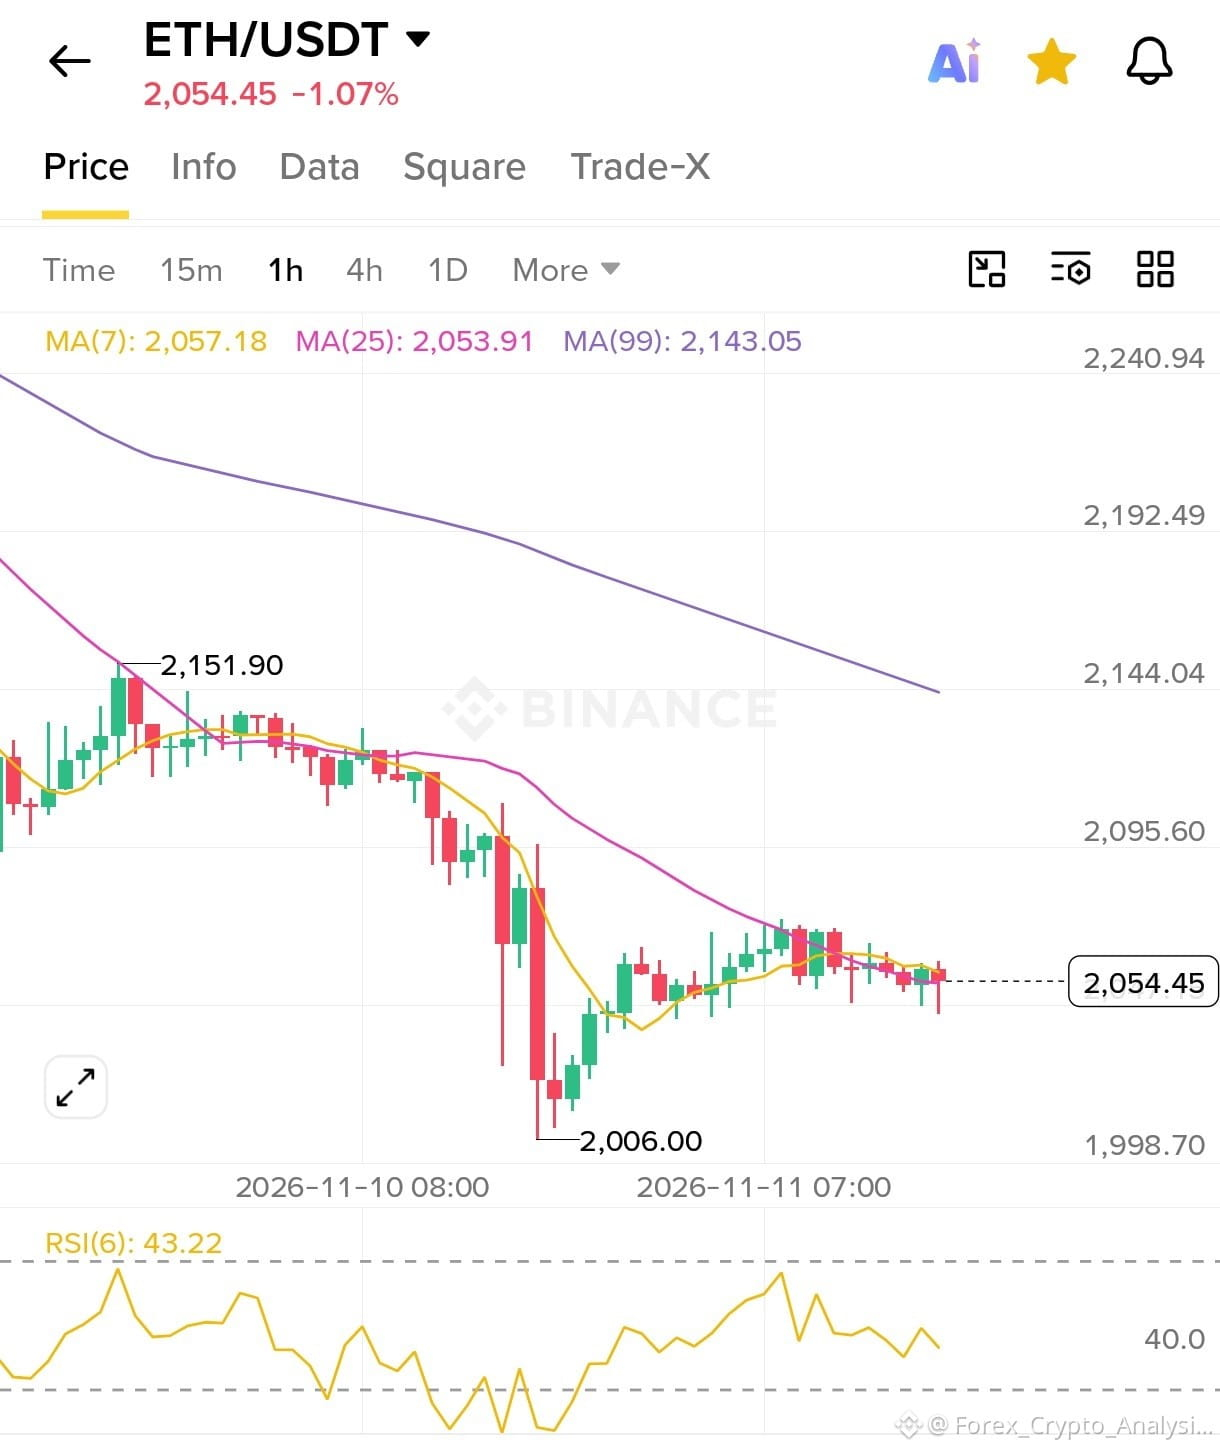
ETH/USDT (1H) Technical Analysis 📉
Looking at the 1-hour chart for ETH/USDT (currently trading around $2,054.45), the short-term market sentiment leans slightly bearish to sideways. Here is a quick breakdown of the key indicators:
🔹 Moving Averages (MA):
• Main Trend: The price is trading well below the downward-sloping MA(99) at $2,143.05, indicating that the broader trend remains bearish.
• Short-Term Resistance: The price is currently squeezed right between MA(7) ($2,057.18) and MA(25) ($2,053.91). Recent red candles suggest selling pressure is building up at these levels.
🔹 RSI Indicator:
• The RSI(6) sits at 43.22 and is pointing downward. Being below the neutral 50 mark shows that sellers currently have slightly more momentum than buyers.
🔹 Key Levels to Watch:
• Support: If the price fails to hold above $2,053, we could see a retest of the $2,030 – $2,006 support zone.
• Resistance: Bulls need to push and hold the price above $2,065 – $2,070 to regain short-term upward momentum.
$ETH
Looking at the 1-hour chart for ETH/USDT (currently trading around $2,054.45), the short-term market sentiment leans slightly bearish to sideways. Here is a quick breakdown of the key indicators:
🔹 Moving Averages (MA):
• Main Trend: The price is trading well below the downward-sloping MA(99) at $2,143.05, indicating that the broader trend remains bearish.
• Short-Term Resistance: The price is currently squeezed right between MA(7) ($2,057.18) and MA(25) ($2,053.91). Recent red candles suggest selling pressure is building up at these levels.
🔹 RSI Indicator:
• The RSI(6) sits at 43.22 and is pointing downward. Being below the neutral 50 mark shows that sellers currently have slightly more momentum than buyers.
🔹 Key Levels to Watch:
• Support: If the price fails to hold above $2,053, we could see a retest of the $2,030 – $2,006 support zone.
• Resistance: Bulls need to push and hold the price above $2,065 – $2,070 to regain short-term upward momentum.
$ETH