$BTC
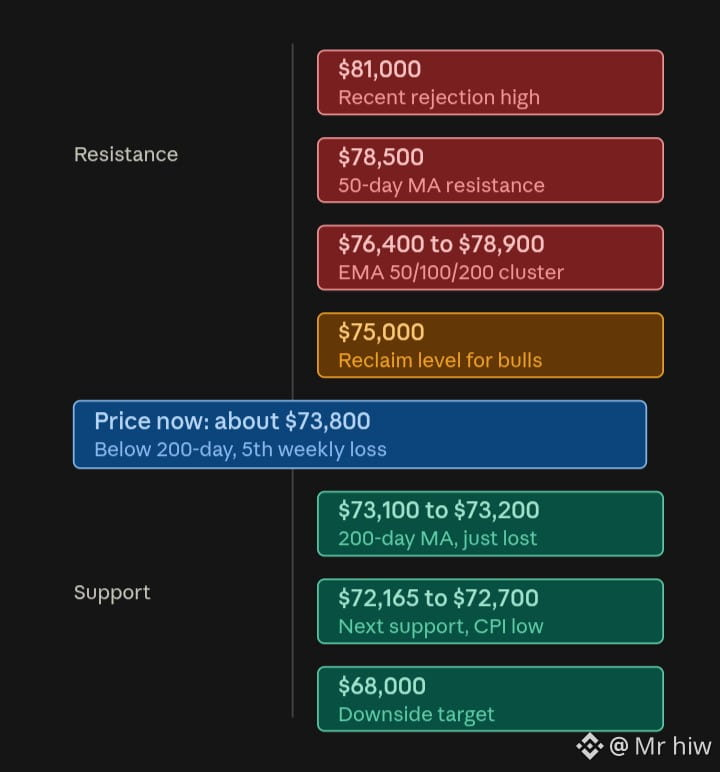
is bearish short term, trading around $73,800 (Nov 11). It dropped about 2% after October CPI came in hotter than expected, and hit an intraday low of $72,787. (crypto) (bitcoin)
Trend: Price is below the $75K–$78K demand zone, with a run of lower highs and lower lows after rejection near $81K. It is also below the 50, 100 and 200-day EMAs, and heading for a fifth straight weekly loss. (cryptorank) (fxstreet)
Flows and positioning:
US spot ETFs saw $1.28B in weekly outflows, and BTC slipped under its 200-day average near $73,100. (cryptorank)
Whales cut holdings by over 34,000 BTC as price fell from $79K, and liquidations reached $723M. (crypto)
Derivatives are heavily leveraged, so a sharp move either way is possible. (fxstreet)
Levels:
Bullish case: reclaiming $75,000, then the $76,400–$78,900 cluster.
Bearish case: losing $72,165 could expose $68,000. (cryptorank)
The chart above is a key-levels map, not a live candlestick chart. For a live chart, use TradingView or CoinMarketCap.
This is general information, not financial advice, and I'm not a financial advisor.#HotCPIDecemberHikePriced #AnthropicRejectsIPODelayValuationinQuestion #CanNvidiaEarningsEaseMarketConcerns? #TradFiForBeginners
is bearish short term, trading around $73,800 (Nov 11). It dropped about 2% after October CPI came in hotter than expected, and hit an intraday low of $72,787. (crypto) (bitcoin)
Trend: Price is below the $75K–$78K demand zone, with a run of lower highs and lower lows after rejection near $81K. It is also below the 50, 100 and 200-day EMAs, and heading for a fifth straight weekly loss. (cryptorank) (fxstreet)
Flows and positioning:
US spot ETFs saw $1.28B in weekly outflows, and BTC slipped under its 200-day average near $73,100. (cryptorank)
Whales cut holdings by over 34,000 BTC as price fell from $79K, and liquidations reached $723M. (crypto)
Derivatives are heavily leveraged, so a sharp move either way is possible. (fxstreet)
Levels:
Bullish case: reclaiming $75,000, then the $76,400–$78,900 cluster.
Bearish case: losing $72,165 could expose $68,000. (cryptorank)
The chart above is a key-levels map, not a live candlestick chart. For a live chart, use TradingView or CoinMarketCap.
This is general information, not financial advice, and I'm not a financial advisor.#HotCPIDecemberHikePriced #AnthropicRejectsIPODelayValuationinQuestion #CanNvidiaEarningsEaseMarketConcerns? #TradFiForBeginners