### Bitcoin (BTC) Technical Analysis
11 November 2026 | English Market Outlook

Market Overview
Bitcoin remains one of the most closely watched assets in the crypto market. Traders should focus on price action, trading volume, and key support and resistance levels before entering a position.
1\. Current Market Structure
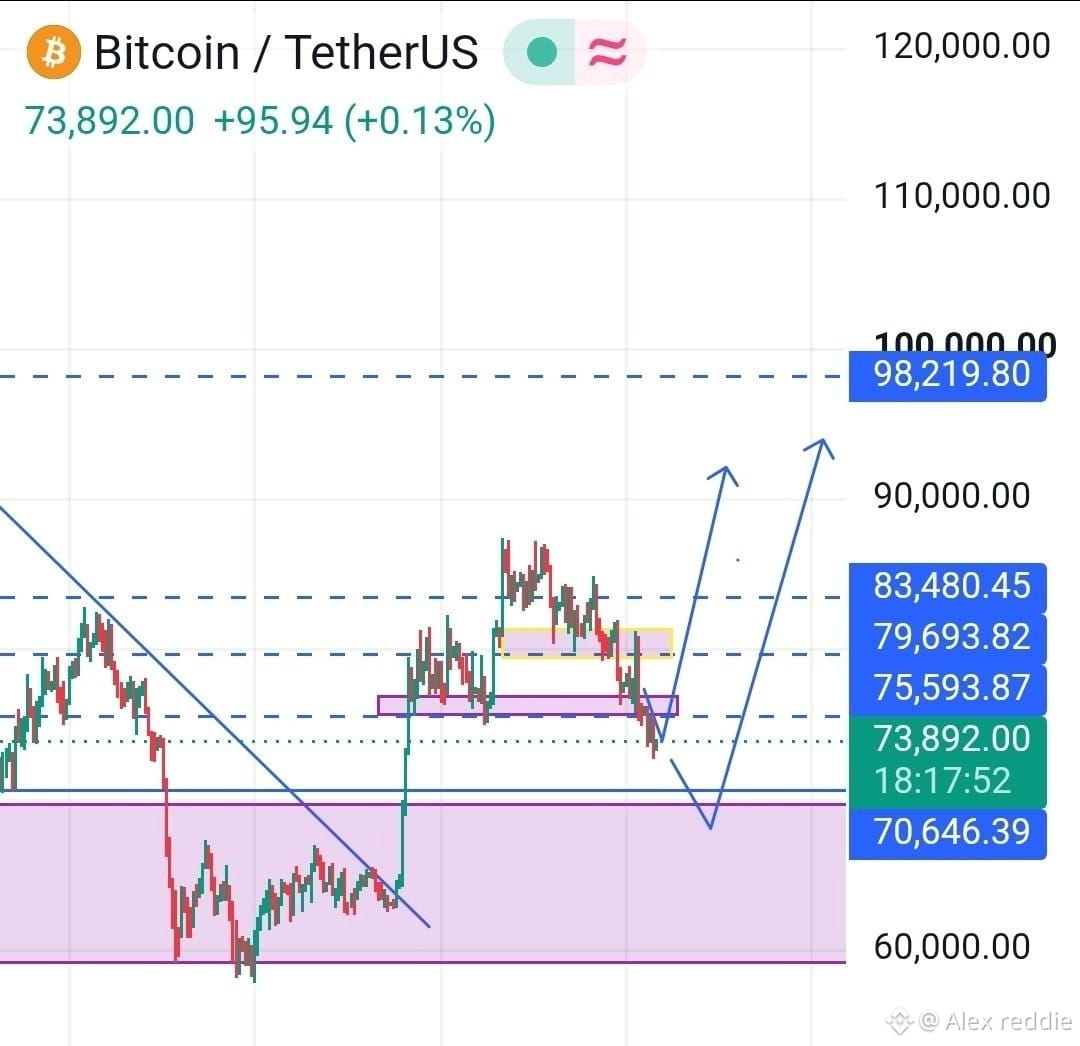
* BTC is trading around $73,700–$74,000.
* The 4H and daily trends are bearish.
* Price is below key short-term moving averages.
* Sellers currently have the advantage. COINOTAG +2
2\. Key Support & Resistance Levels
| Level | Price |
| ------------- | -------- |
| Resistance 3 | $78,650 |
| Resistance 2 | $76,400 |
| Resistance 1 | $74,500 |
| Current price | ~$73,700 |
| Support 1 | $73,100 |
| Support 2 | $71,750 |
| Support 3 | $70,250 |
COINOTAG +1
3\. Technical Indicators
* RSI (14): Around 34 — weak momentum.
* MACD: Negative — bearish momentum.
* Moving averages: Short-term bearish alignment.
* Overall trend: Downward pressure remains.
COINOTAG +1
4\. Possible Market Scenarios
Bearish scenario
Main risk
If BTC breaks below $73,100 with strong selling volume, the next potential downside levels are $71,750 and $70,250.
Bullish scenario
Needs confirmation
If BTC reclaims $74,500 and holds above it, a recovery toward $76,400 could become possible.
$BTC
5\. My Market Outlook
Bitcoin is showing weakness, and buyers have not yet demonstrated enough strength to confirm a trend reversal.
I would avoid chasing long positions until BTC shows a clear bullish confirmation. A breakdown below support could create further downside pressure.
11 November 2026 | English Market Outlook

Market Overview
Bitcoin remains one of the most closely watched assets in the crypto market. Traders should focus on price action, trading volume, and key support and resistance levels before entering a position.
1\. Current Market Structure
* BTC is trading around $73,700–$74,000.
* The 4H and daily trends are bearish.
* Price is below key short-term moving averages.
* Sellers currently have the advantage. COINOTAG +2
2\. Key Support & Resistance Levels
| Level | Price |
| ------------- | -------- |
| Resistance 3 | $78,650 |
| Resistance 2 | $76,400 |
| Resistance 1 | $74,500 |
| Current price | ~$73,700 |
| Support 1 | $73,100 |
| Support 2 | $71,750 |
| Support 3 | $70,250 |
COINOTAG +1
3\. Technical Indicators
* RSI (14): Around 34 — weak momentum.
* MACD: Negative — bearish momentum.
* Moving averages: Short-term bearish alignment.
* Overall trend: Downward pressure remains.
COINOTAG +1
4\. Possible Market Scenarios
Bearish scenario
Main risk
If BTC breaks below $73,100 with strong selling volume, the next potential downside levels are $71,750 and $70,250.
Bullish scenario
Needs confirmation
If BTC reclaims $74,500 and holds above it, a recovery toward $76,400 could become possible.
$BTC
5\. My Market Outlook
Bitcoin is showing weakness, and buyers have not yet demonstrated enough strength to confirm a trend reversal.
I would avoid chasing long positions until BTC shows a clear bullish confirmation. A breakdown below support could create further downside pressure.