$PEPE: Why Consistency in How You Measure Metrics Matters More Than Exotic Formulas
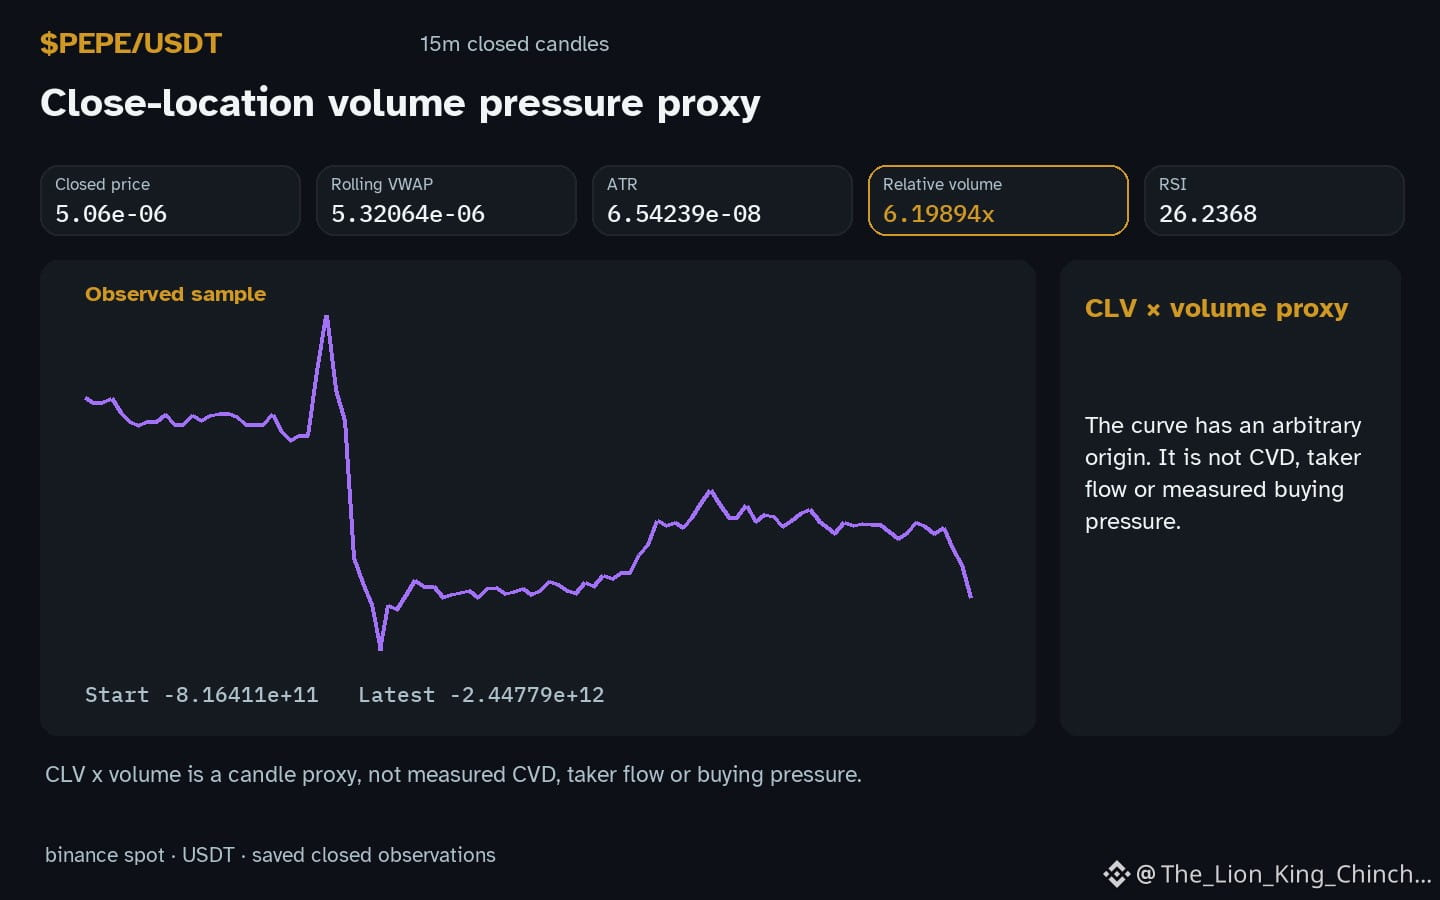
How does $PEPE react when its measured volume is simply 'above baseline' while price sits below local support? To think about it, imagine a hypothetical chart tracker that only compares today's activity to a fixed multiple of the average. If the tracker uses identical rules for every session, a bar marked high just means the window is populated. No assumptions about why participants are present, no causal link, and no forecast are added.
Now reconsider with different rules. If the baseline shrinks to hourly bars, the same raw count can become marked as normal. The shift is mechanical but it creates two different sets of possible trades. One might define an invalidation level further away to allow more noise, choosing a worse entry price. The other rejects the 'volume is elevated' signal completely because the baseline was moved. Neither is the 'right' mechanism for thinking about observation, yet both constrain what count of invalidation makes practical sense.
The limits of this model are strict. It only relies on the provided 6.19894, the 20 duration, and that the price is below 5.14e-06. It does not know about order flow, hidden structures, or intent. A self check is simple: document your baseline rule in writing. If a different window turns the same value into a different classification, then your standard observation is just arbitrary noise in this context until you close that gap. Standardizing how you measure is a prerequisite, not a guarantee, for interpreting the 26.2368 moving alongside the range.
Probabilistic market research, not a recommendation or guaranteed return.
Clear invalidation or a stronger-looking entry?
#PEPE #RiskManagement
How does $PEPE react when its measured volume is simply 'above baseline' while price sits below local support? To think about it, imagine a hypothetical chart tracker that only compares today's activity to a fixed multiple of the average. If the tracker uses identical rules for every session, a bar marked high just means the window is populated. No assumptions about why participants are present, no causal link, and no forecast are added.
Now reconsider with different rules. If the baseline shrinks to hourly bars, the same raw count can become marked as normal. The shift is mechanical but it creates two different sets of possible trades. One might define an invalidation level further away to allow more noise, choosing a worse entry price. The other rejects the 'volume is elevated' signal completely because the baseline was moved. Neither is the 'right' mechanism for thinking about observation, yet both constrain what count of invalidation makes practical sense.
The limits of this model are strict. It only relies on the provided 6.19894, the 20 duration, and that the price is below 5.14e-06. It does not know about order flow, hidden structures, or intent. A self check is simple: document your baseline rule in writing. If a different window turns the same value into a different classification, then your standard observation is just arbitrary noise in this context until you close that gap. Standardizing how you measure is a prerequisite, not a guarantee, for interpreting the 26.2368 moving alongside the range.
Probabilistic market research, not a recommendation or guaranteed return.
Clear invalidation or a stronger-looking entry?
#PEPE #RiskManagement