$SOPH: When Volume Hides the Pause
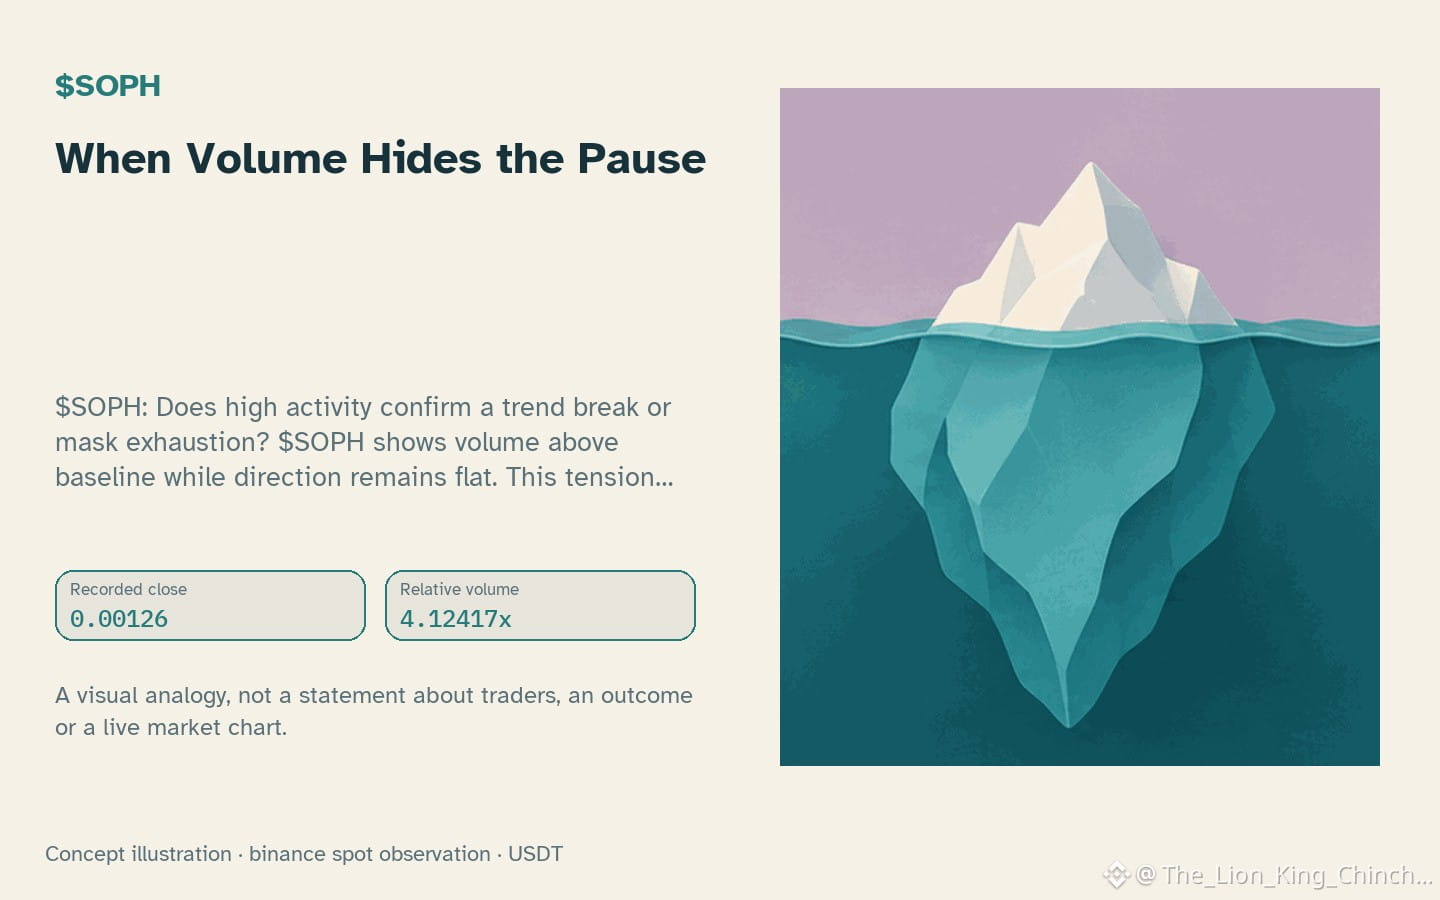
$SOPH: Does high activity confirm a trend break or mask exhaustion? $SOPH shows volume above baseline while direction remains flat. This tension asks if broad participation supports current levels or signals fatigue. High breadth often accompanies range expansion, yet it rarely predicts direction alone.
One clue is relative momentum. If price holds near 0.00127153 while activity rises, buyers may defend prior sessions. An alternative reading suggests random churn within 20 bars. To weaken the first view, look for a close below 0.00126 despite strong activity. That would imply sellers overwhelmed interest without structural change. To weaken the second, observe a decisive break above 0.00129 with sustained momentum. Without this, the high activity remains neutral noise rather than directional proof.
Use 42.6812 as a secondary filter, not a trigger. A rising RSI with flat price indicates effort without progress. This mismatch highlights internal conflict. A practical check involves waiting for the next candle. If it closes inside the prior range, the battle remains unresolved. If it breaks cleanly, the earlier activity gains significance. Do not assume intent from candle size. These mechanics are hypothetical frameworks for reading data, not predictions. Context matters: 1.2095e-05 defines the expected noise floor. Moves smaller than half an ATR are rarely decisive. Keep expectations low until price confirms structure.
Probabilistic market research, not a recommendation or guaranteed return.
A useful cross-check: $ETH has hourly direction down and volume not above its baseline; $ERA has hourly direction down and volume not above its baseline. This alone does not establish correlation.
A clean close or a retest: which would add evidence?
#SOPH #ETH #ERA #MarketAnalysis
$SOPH: Does high activity confirm a trend break or mask exhaustion? $SOPH shows volume above baseline while direction remains flat. This tension asks if broad participation supports current levels or signals fatigue. High breadth often accompanies range expansion, yet it rarely predicts direction alone.
One clue is relative momentum. If price holds near 0.00127153 while activity rises, buyers may defend prior sessions. An alternative reading suggests random churn within 20 bars. To weaken the first view, look for a close below 0.00126 despite strong activity. That would imply sellers overwhelmed interest without structural change. To weaken the second, observe a decisive break above 0.00129 with sustained momentum. Without this, the high activity remains neutral noise rather than directional proof.
Use 42.6812 as a secondary filter, not a trigger. A rising RSI with flat price indicates effort without progress. This mismatch highlights internal conflict. A practical check involves waiting for the next candle. If it closes inside the prior range, the battle remains unresolved. If it breaks cleanly, the earlier activity gains significance. Do not assume intent from candle size. These mechanics are hypothetical frameworks for reading data, not predictions. Context matters: 1.2095e-05 defines the expected noise floor. Moves smaller than half an ATR are rarely decisive. Keep expectations low until price confirms structure.
Probabilistic market research, not a recommendation or guaranteed return.
A useful cross-check: $ETH has hourly direction down and volume not above its baseline; $ERA has hourly direction down and volume not above its baseline. This alone does not establish correlation.
A clean close or a retest: which would add evidence?
#SOPH #ETH #ERA #MarketAnalysis