🔥 $PEPE Technical Update: Key Levels & Momentum Breakdown
📊 1. Market Snapshot
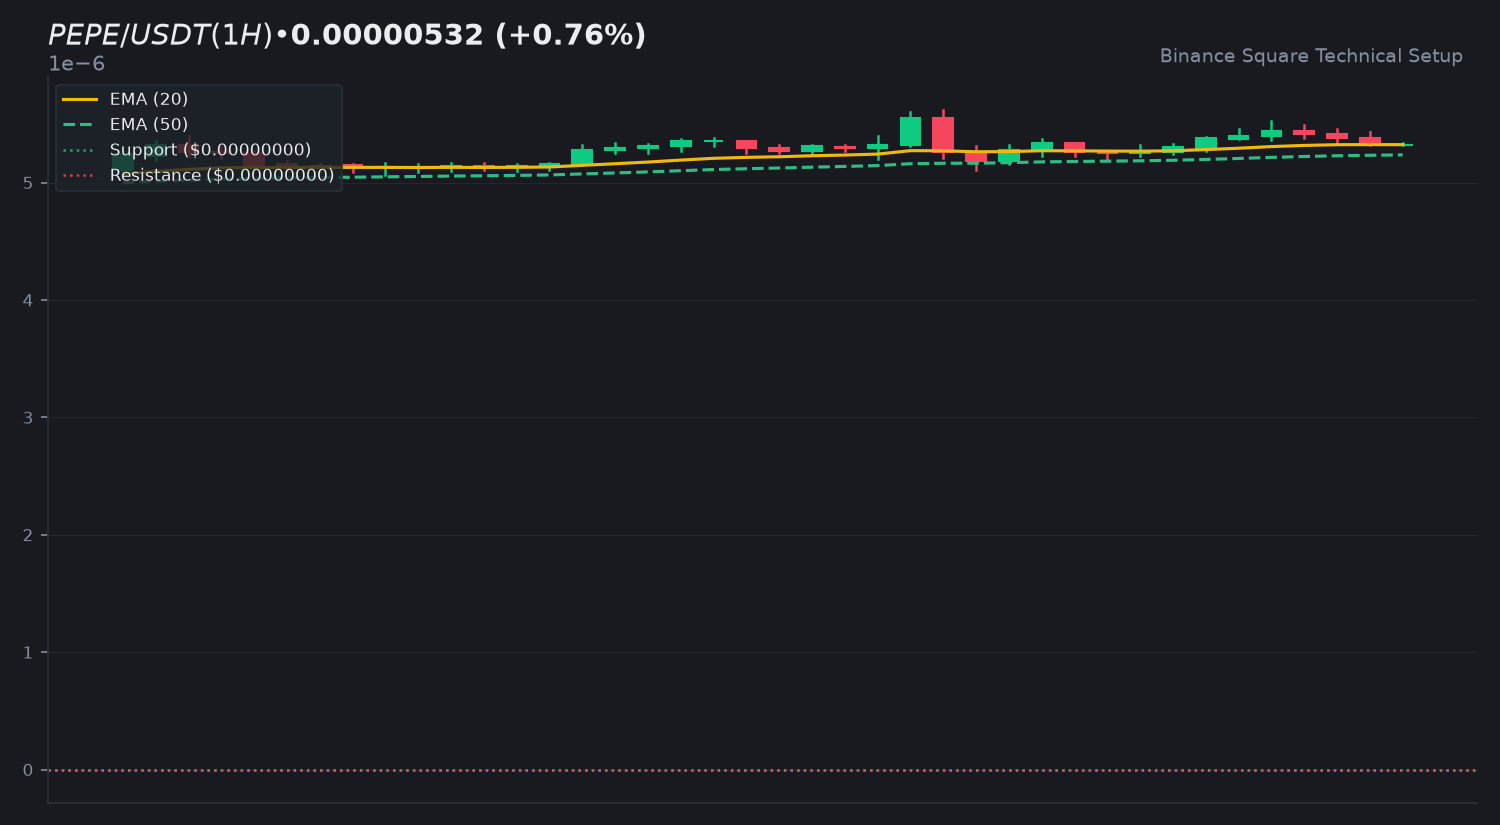
The $PEPE token is currently exhibiting a modest recovery phase with a 24h gain of +0.76 percent. Total 24h quote volume stands at $97,144,831 USDT, reflecting stable but currently constrained market interest on the order books.
📈 2. Technical Momentum & Indicator Bias
Price action for $PEPE is currently hovering near the EMA 20 and EMA 50 indicators, signaling an ongoing trend reversal attempt. The 14-period RSI prints at 51.32, sitting in a neutral zone and indicating a balance of buying and selling pressure. Meanwhile, the MACD histogram shows minimal momentum separation, while the volume ratio to the 20-SMA points toward low-conviction consolidation.
🎯 3. Key Technical Levels to Watch
• 🟢 Resistance Zone: Immediate overhead resistance stands at the local supply boundary, with secondary extensions higher.
• 🔴 Support Zone: Key support floors are identified at the primary local low, backed by secondary structural support underneath.
• 🛡️ Pivot Confluence: The moving average cluster acts as the main pivot area for near-term trend confirmation.
💡 4. Technical Takeaway & Risk Management
Traders should observe how price reacts around the EMA convergence zones alongside volume expansions. Low-volume consolidation phases often precede volatility expansions, making risk management essential.
💬 5. Community Discussion
What is your technical outlook for $PEPE this week? Are you accumulating near the support floors or waiting for a high-volume breakout confirmation? Drop your thoughts below! 👇
⚠️ 6. Disclaimer
Educational technical analysis only. Not financial advice (NFA). Crypto markets involve substantial risk. Always DYOR.
$PEPE #PEPE #BinanceSquare
📊 1. Market Snapshot
The $PEPE token is currently exhibiting a modest recovery phase with a 24h gain of +0.76 percent. Total 24h quote volume stands at $97,144,831 USDT, reflecting stable but currently constrained market interest on the order books.
📈 2. Technical Momentum & Indicator Bias
Price action for $PEPE is currently hovering near the EMA 20 and EMA 50 indicators, signaling an ongoing trend reversal attempt. The 14-period RSI prints at 51.32, sitting in a neutral zone and indicating a balance of buying and selling pressure. Meanwhile, the MACD histogram shows minimal momentum separation, while the volume ratio to the 20-SMA points toward low-conviction consolidation.
🎯 3. Key Technical Levels to Watch
• 🟢 Resistance Zone: Immediate overhead resistance stands at the local supply boundary, with secondary extensions higher.
• 🔴 Support Zone: Key support floors are identified at the primary local low, backed by secondary structural support underneath.
• 🛡️ Pivot Confluence: The moving average cluster acts as the main pivot area for near-term trend confirmation.
💡 4. Technical Takeaway & Risk Management
Traders should observe how price reacts around the EMA convergence zones alongside volume expansions. Low-volume consolidation phases often precede volatility expansions, making risk management essential.
💬 5. Community Discussion
What is your technical outlook for $PEPE this week? Are you accumulating near the support floors or waiting for a high-volume breakout confirmation? Drop your thoughts below! 👇
⚠️ 6. Disclaimer
Educational technical analysis only. Not financial advice (NFA). Crypto markets involve substantial risk. Always DYOR.
$PEPE #PEPE #BinanceSquare