🚀 $BNB / USDT 15m Chart Update: Sharp Bounce & Moving Average Convergence! 🔥📈
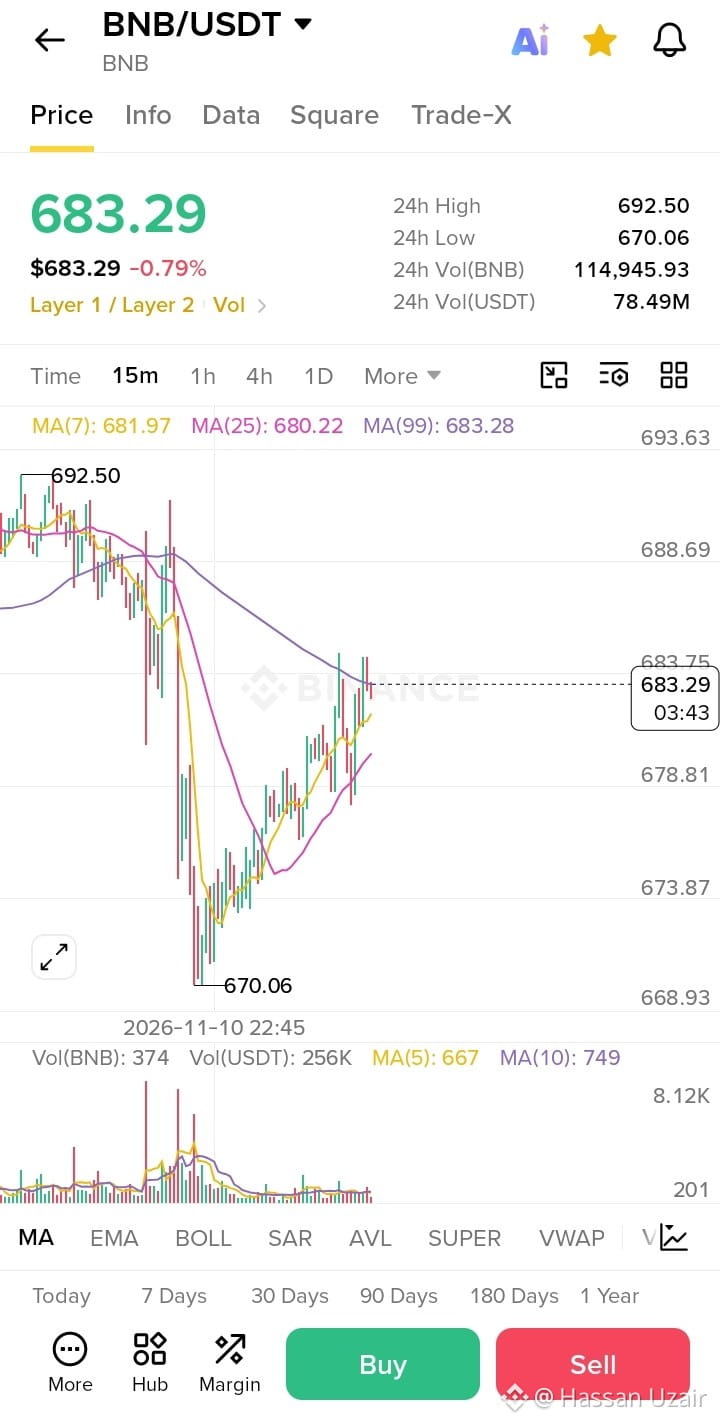
Looking at the latest 15m chart, $BNB is trading at $683.29 (-0.79%) after staging a strong recovery rally from a 24h low of $670.06 back up toward a high of $692.50.
💡 Key Technical Highlights:
🔹 Current Price: $683.29
🔹 24h Range: $670.06 - $692.50
🔹 Moving Averages: Price is consolidating right around the moving average cluster—MA(7) at $681.97, MA(25) at $680.22, and MA(99) flat at $683.28—reflecting a tight equilibrium as bulls and bears fight for control.
🔹 Market Outlook: The massive volume spike at the $670.06 support wick highlights a clean liquidity sweep and aggressive dip-buying. Sustaining above this immediate MA convergence zone could pave the way for another push toward the $692 resistance ceiling.
💬 Traders, let's discuss! Did you catch the recovery bounce near $670, or are you waiting for a breakout confirmation above the moving averages? Drop your strategy below! 👇🔥
#BNB #BNBUSDT #BinanceSquare #CryptoTrading #TechnicalAnalysis #Layer1 #Altcoins
Looking at the latest 15m chart, $BNB is trading at $683.29 (-0.79%) after staging a strong recovery rally from a 24h low of $670.06 back up toward a high of $692.50.
💡 Key Technical Highlights:
🔹 Current Price: $683.29
🔹 24h Range: $670.06 - $692.50
🔹 Moving Averages: Price is consolidating right around the moving average cluster—MA(7) at $681.97, MA(25) at $680.22, and MA(99) flat at $683.28—reflecting a tight equilibrium as bulls and bears fight for control.
🔹 Market Outlook: The massive volume spike at the $670.06 support wick highlights a clean liquidity sweep and aggressive dip-buying. Sustaining above this immediate MA convergence zone could pave the way for another push toward the $692 resistance ceiling.
💬 Traders, let's discuss! Did you catch the recovery bounce near $670, or are you waiting for a breakout confirmation above the moving averages? Drop your strategy below! 👇🔥
#BNB #BNBUSDT #BinanceSquare #CryptoTrading #TechnicalAnalysis #Layer1 #Altcoins