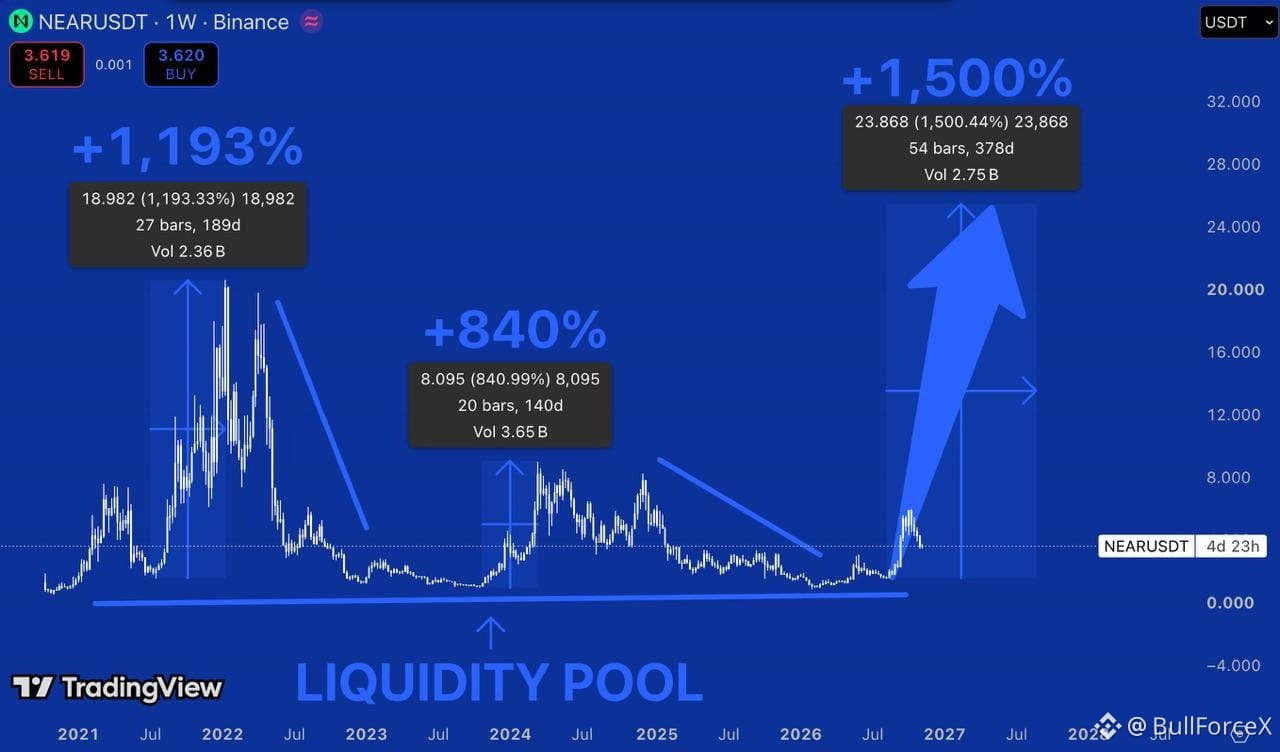
$NEAR is trading around $3.62.
And this weekly chart is showing a pattern we've already seen twice before.
In 2021, NEAR delivered an incredible 1,193% rally.
Then in 2024, another explosive move of 840%.
Two different market cycles.
Two massive rallies.
And both started after extended periods of consolidation near the lows.
Now look at what's happening.
After another brutal correction, NEAR returned to its long-term liquidity zone.
Buyers have already pushed price toward $6, but the rally was followed by another pullback.
And this is where things get interesting.
If $NEAR can defend the $2.50–3.00 region and reclaim $5–6, the weekly structure could begin shifting bullish again.
Here's my roadmap.
$5–6 — First major resistance.
$8–10 — Next important target.
$13–15 — Major historical resistance.
$20 — Previous cycle highs.
And $25+? That's my aggressive bull scenario.
The chart illustrates a potential 1,500% rally from its marked historical base.
Sounds ambitious?
Absolutely.
But remember, NEAR has already delivered two rallies exceeding 800% in previous cycles.
Of course, that doesn't guarantee a third.
The important thing now is whether buyers can establish higher lows and break the sequence of lower highs that has dominated the weekly structure.
Without that confirmation, another rejection remains possible.
But here's what fascinates me.
Every major expansion on this chart began when sentiment was weak and price was trading near long-term support.
Now we're approaching another important decision point.
Will history repeat itself?
Nobody knows.
But if $NEAR confirms a genuine trend reversal, I wouldn't underestimate what could follow
And this weekly chart is showing a pattern we've already seen twice before.
In 2021, NEAR delivered an incredible 1,193% rally.
Then in 2024, another explosive move of 840%.
Two different market cycles.
Two massive rallies.
And both started after extended periods of consolidation near the lows.
Now look at what's happening.
After another brutal correction, NEAR returned to its long-term liquidity zone.
Buyers have already pushed price toward $6, but the rally was followed by another pullback.
And this is where things get interesting.
If $NEAR can defend the $2.50–3.00 region and reclaim $5–6, the weekly structure could begin shifting bullish again.
Here's my roadmap.
$5–6 — First major resistance.
$8–10 — Next important target.
$13–15 — Major historical resistance.
$20 — Previous cycle highs.
And $25+? That's my aggressive bull scenario.
The chart illustrates a potential 1,500% rally from its marked historical base.
Sounds ambitious?
Absolutely.
But remember, NEAR has already delivered two rallies exceeding 800% in previous cycles.
Of course, that doesn't guarantee a third.
The important thing now is whether buyers can establish higher lows and break the sequence of lower highs that has dominated the weekly structure.
Without that confirmation, another rejection remains possible.
But here's what fascinates me.
Every major expansion on this chart began when sentiment was weak and price was trading near long-term support.
Now we're approaching another important decision point.
Will history repeat itself?
Nobody knows.
But if $NEAR confirms a genuine trend reversal, I wouldn't underestimate what could follow