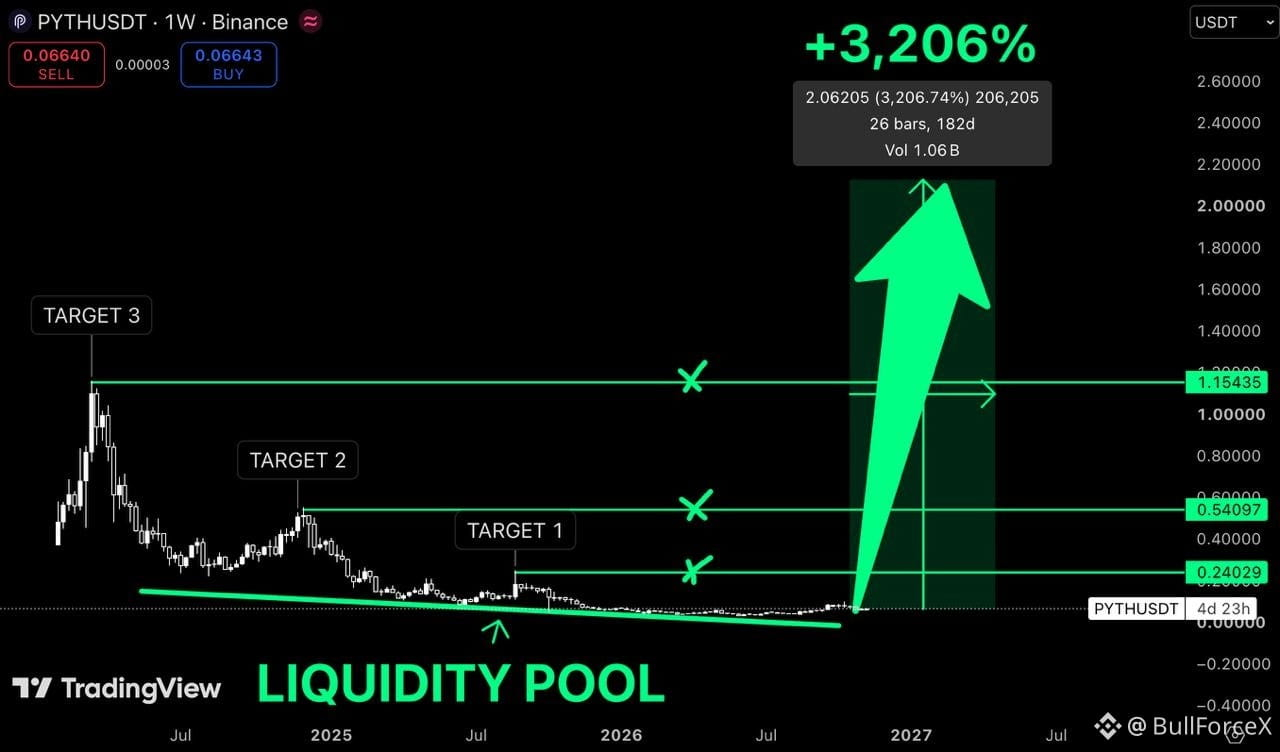
$PYTH is trading around $0.066.
And this weekly chart is approaching a point where things could get very interesting.
Back in 2024, $PYTH traded above $1.
Since then, it's been a brutal downtrend.
Lower highs. Failed recoveries. Almost every rally sold into.
But look at where price is now.
After years of selling pressure, PYTH has returned to a major long-term liquidity zone near its historical lows.
And the downward momentum appears to be slowing.
Could this be the beginning of a new accumulation phase?
Possibly. But the structure still needs confirmation.
Here's what I'm watching.
$0.24 — First major resistance.
$0.54 — Second target.
$1.15 — Previous major high.
And $2.10+? That's my extreme bull scenario.
The chart illustrates a potential 3,206% move from its marked historical base.
That's an enormous projection.
And for it to become realistic, $PYTH would need a complete shift in momentum, sustained buying pressure, and a decisive break of its long-term bearish structure.
The first thing I want to see is price reclaiming $0.10–0.12 and establishing higher lows.
Without that, this is still just a speculative recovery setup.
But the market psychology is interesting.
When PYTH was trading above $1, everyone was watching.
Now it's around $0.066, and hardly anyone seems interested.
That alone isn't a buy signal.
But if the trend finally reverses, sentiment could change very quickly.
And this weekly chart is approaching a point where things could get very interesting.
Back in 2024, $PYTH traded above $1.
Since then, it's been a brutal downtrend.
Lower highs. Failed recoveries. Almost every rally sold into.
But look at where price is now.
After years of selling pressure, PYTH has returned to a major long-term liquidity zone near its historical lows.
And the downward momentum appears to be slowing.
Could this be the beginning of a new accumulation phase?
Possibly. But the structure still needs confirmation.
Here's what I'm watching.
$0.24 — First major resistance.
$0.54 — Second target.
$1.15 — Previous major high.
And $2.10+? That's my extreme bull scenario.
The chart illustrates a potential 3,206% move from its marked historical base.
That's an enormous projection.
And for it to become realistic, $PYTH would need a complete shift in momentum, sustained buying pressure, and a decisive break of its long-term bearish structure.
The first thing I want to see is price reclaiming $0.10–0.12 and establishing higher lows.
Without that, this is still just a speculative recovery setup.
But the market psychology is interesting.
When PYTH was trading above $1, everyone was watching.
Now it's around $0.066, and hardly anyone seems interested.
That alone isn't a buy signal.
But if the trend finally reverses, sentiment could change very quickly.