🔥 $ZEC Technical Update: Key Levels & Momentum Breakdown
📊 1. Market Snapshot
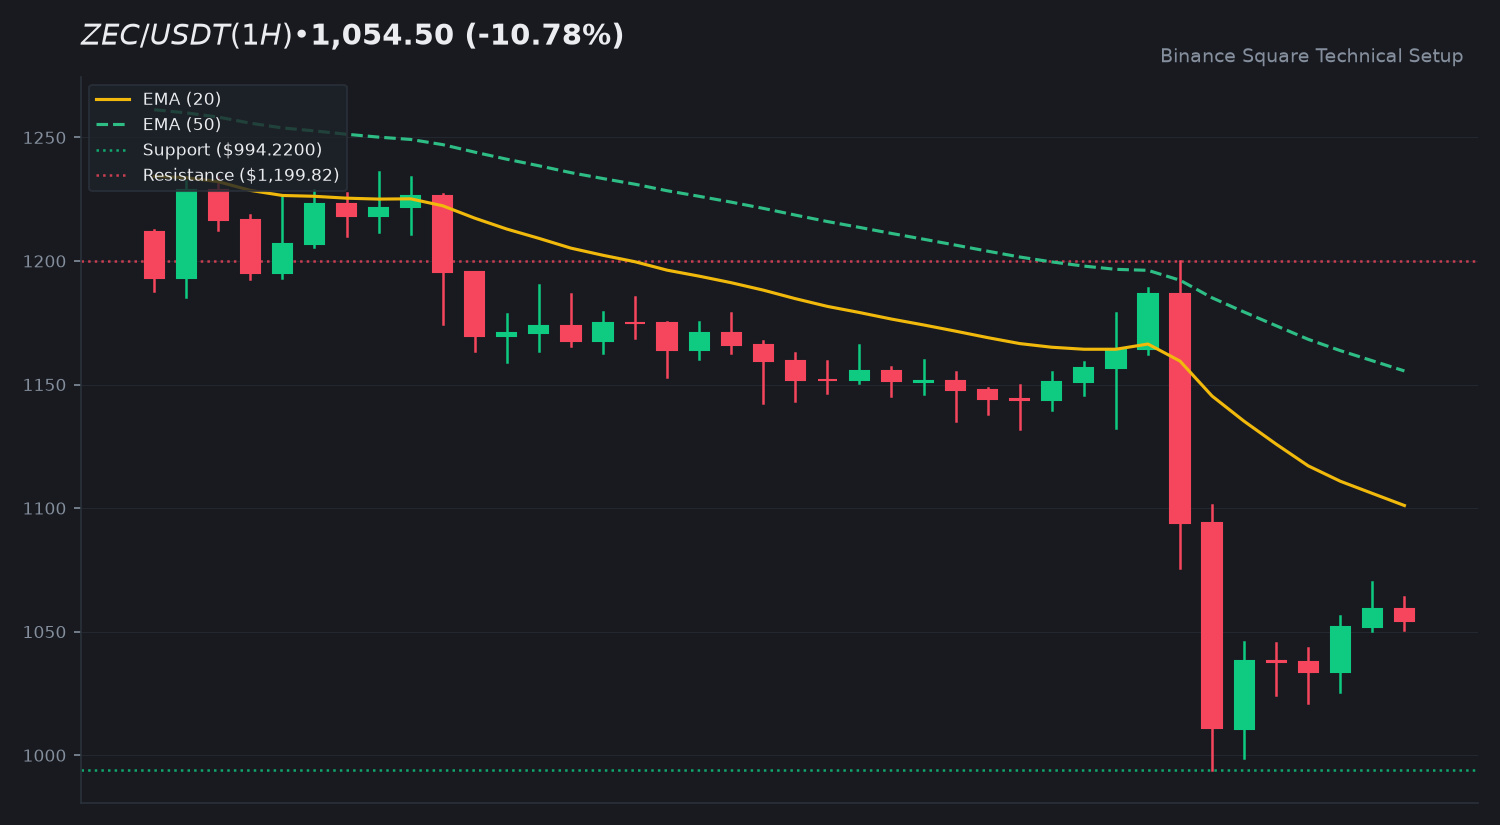
$ZEC is trading at $1,054.50, reflecting a 24-hour decrease of 10.78 percent. The asset experienced a daily high of $1,199.82 and a low of $994.22, accompanied by a 24-hour quote volume of 254,704,822 USDT on current session tracking.
📈 2. Technical Momentum & Indicator Bias
Price action remains below both the EMA 20 at $1,101.04 and the EMA 50 at $1,155.50, indicating an ongoing downside trend structure. The 14-period RSI sits at 34.5, approaching oversold territory without a confirmed reversal signal. Meanwhile, the MACD histogram prints at -5.30 with negative MACD line posture, signaling continued bearish momentum with low relative volume backing the current consolidation.
🎯 3. Key Technical Levels to Watch
• 🟢 Resistance Zone: Immediate resistance is established near the 24-hour high of $1,199.82, with secondary resistance extending toward $1,239.89.
• 🔴 Support Zone: The primary support floor rests at the 24-hour low of $994.22.
• 🛡️ Pivot Confluence: The EMA 20 line at $1,101.04 acts as the near-term structural pivot for trend normalization.
💡 4. Technical Takeaway & Risk Management
Prudent market participants monitor volume expansion and price stabilization around the immediate support floor before evaluating trend shifts. Maintaining disciplined risk parameters and managing exposure remains essential during volatile corrective phases.
💬 5. Community Discussion
What is your technical outlook for $ZEC this week? Are you accumulating or waiting for confirmation? Drop your thoughts below! 👇
⚠️ 6. Disclaimer
Educational technical analysis only. Not financial advice (NFA). Crypto markets involve risk. Always DYOR.
$ZEC #ZEC #BinanceSquare
📊 1. Market Snapshot
$ZEC is trading at $1,054.50, reflecting a 24-hour decrease of 10.78 percent. The asset experienced a daily high of $1,199.82 and a low of $994.22, accompanied by a 24-hour quote volume of 254,704,822 USDT on current session tracking.
📈 2. Technical Momentum & Indicator Bias
Price action remains below both the EMA 20 at $1,101.04 and the EMA 50 at $1,155.50, indicating an ongoing downside trend structure. The 14-period RSI sits at 34.5, approaching oversold territory without a confirmed reversal signal. Meanwhile, the MACD histogram prints at -5.30 with negative MACD line posture, signaling continued bearish momentum with low relative volume backing the current consolidation.
🎯 3. Key Technical Levels to Watch
• 🟢 Resistance Zone: Immediate resistance is established near the 24-hour high of $1,199.82, with secondary resistance extending toward $1,239.89.
• 🔴 Support Zone: The primary support floor rests at the 24-hour low of $994.22.
• 🛡️ Pivot Confluence: The EMA 20 line at $1,101.04 acts as the near-term structural pivot for trend normalization.
💡 4. Technical Takeaway & Risk Management
Prudent market participants monitor volume expansion and price stabilization around the immediate support floor before evaluating trend shifts. Maintaining disciplined risk parameters and managing exposure remains essential during volatile corrective phases.
💬 5. Community Discussion
What is your technical outlook for $ZEC this week? Are you accumulating or waiting for confirmation? Drop your thoughts below! 👇
⚠️ 6. Disclaimer
Educational technical analysis only. Not financial advice (NFA). Crypto markets involve risk. Always DYOR.
$ZEC #ZEC #BinanceSquare