🔥 $ETH Technical Update: Key Levels & Momentum Breakdown
📊 1. Market Snapshot
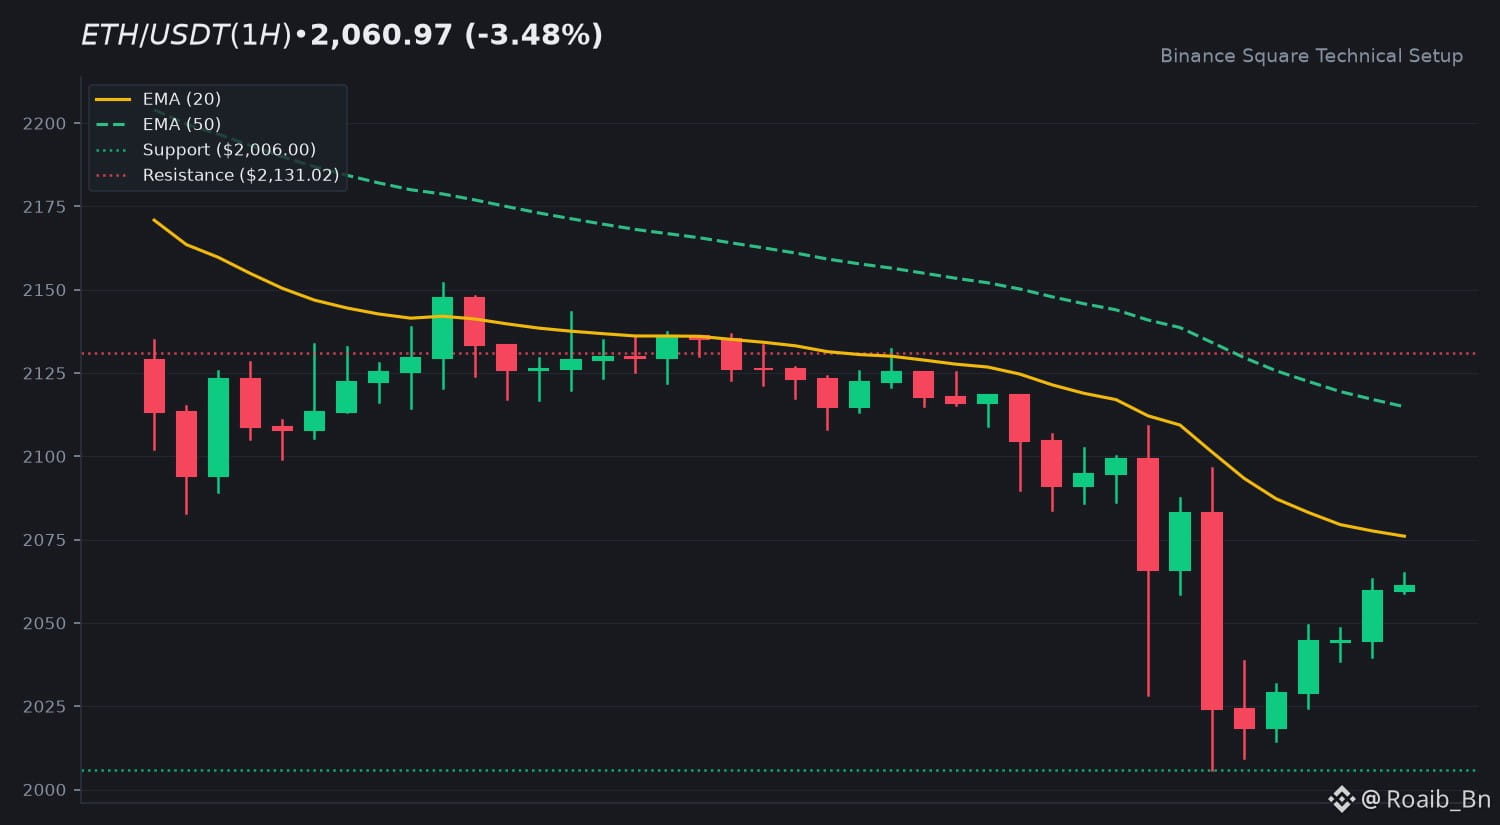
$ETH is currently trading at $2,060.97, reflecting a 24-hour decline of -3.48%. Price action ranged between an intraday high of $2,137.30 and a low of $2,006.00, accompanied by a 24h quote volume of $690,913,045 USDT, indicating low volume consolidation and weak near-term conviction.
📈 2. Technical Momentum & Indicator Bias
The broader trend context remains a strong downtrend. The EMA 20 sits at $2,076.02, while the EMA 50 is positioned higher at $2,114.88, with price currently hovering below both moving averages. The 14-period RSI prints at 41.01, maintaining a neutral to slightly bearish bias without entering oversold territory. Meanwhile, the MACD histogram registers at -0.8812, reflecting persistent negative momentum underneath the signal line.
🎯 3. Key Technical Levels to Watch
• 🟢 Resistance Zone: Immediate overhead resistance is established near $2,131.02, followed by a secondary target extension at $2,247.73.
• 🔴 Support Zone: The primary downside floor rests at the 24h low of $2,006.00.
• 🛡️ Pivot Confluence: The EMA 20 at $2,076.02 acts as the immediate dynamic pivot for trend evaluation.
💡 4. Technical Takeaway & Risk Management
Price action continues to respect the descending dynamic resistance defined by the short-term moving averages. Market participants should monitor volume participation closely around the immediate support floor and dynamic EMA bands to gauge potential trend continuation or consolidation phases.
💬 5. Community Discussion
What is your technical outlook for $ETH this week? Are you tracking consolidation patterns or waiting for volume confirmation? Drop your thoughts below! 👇
⚠️ 6. Disclaimer
Educational technical analysis only. Not financial advice (NFA). Crypto markets involve risk. Always DYOR.
$ETH #ETH #BinanceSquare
📊 1. Market Snapshot
$ETH is currently trading at $2,060.97, reflecting a 24-hour decline of -3.48%. Price action ranged between an intraday high of $2,137.30 and a low of $2,006.00, accompanied by a 24h quote volume of $690,913,045 USDT, indicating low volume consolidation and weak near-term conviction.
📈 2. Technical Momentum & Indicator Bias
The broader trend context remains a strong downtrend. The EMA 20 sits at $2,076.02, while the EMA 50 is positioned higher at $2,114.88, with price currently hovering below both moving averages. The 14-period RSI prints at 41.01, maintaining a neutral to slightly bearish bias without entering oversold territory. Meanwhile, the MACD histogram registers at -0.8812, reflecting persistent negative momentum underneath the signal line.
🎯 3. Key Technical Levels to Watch
• 🟢 Resistance Zone: Immediate overhead resistance is established near $2,131.02, followed by a secondary target extension at $2,247.73.
• 🔴 Support Zone: The primary downside floor rests at the 24h low of $2,006.00.
• 🛡️ Pivot Confluence: The EMA 20 at $2,076.02 acts as the immediate dynamic pivot for trend evaluation.
💡 4. Technical Takeaway & Risk Management
Price action continues to respect the descending dynamic resistance defined by the short-term moving averages. Market participants should monitor volume participation closely around the immediate support floor and dynamic EMA bands to gauge potential trend continuation or consolidation phases.
💬 5. Community Discussion
What is your technical outlook for $ETH this week? Are you tracking consolidation patterns or waiting for volume confirmation? Drop your thoughts below! 👇
⚠️ 6. Disclaimer
Educational technical analysis only. Not financial advice (NFA). Crypto markets involve risk. Always DYOR.
$ETH #ETH #BinanceSquare