⚡ Market Titans Dual Analysis: Bitcoin $BTC vs Ethereum $ETH
1. Bitcoin $BTC Technical Outlook
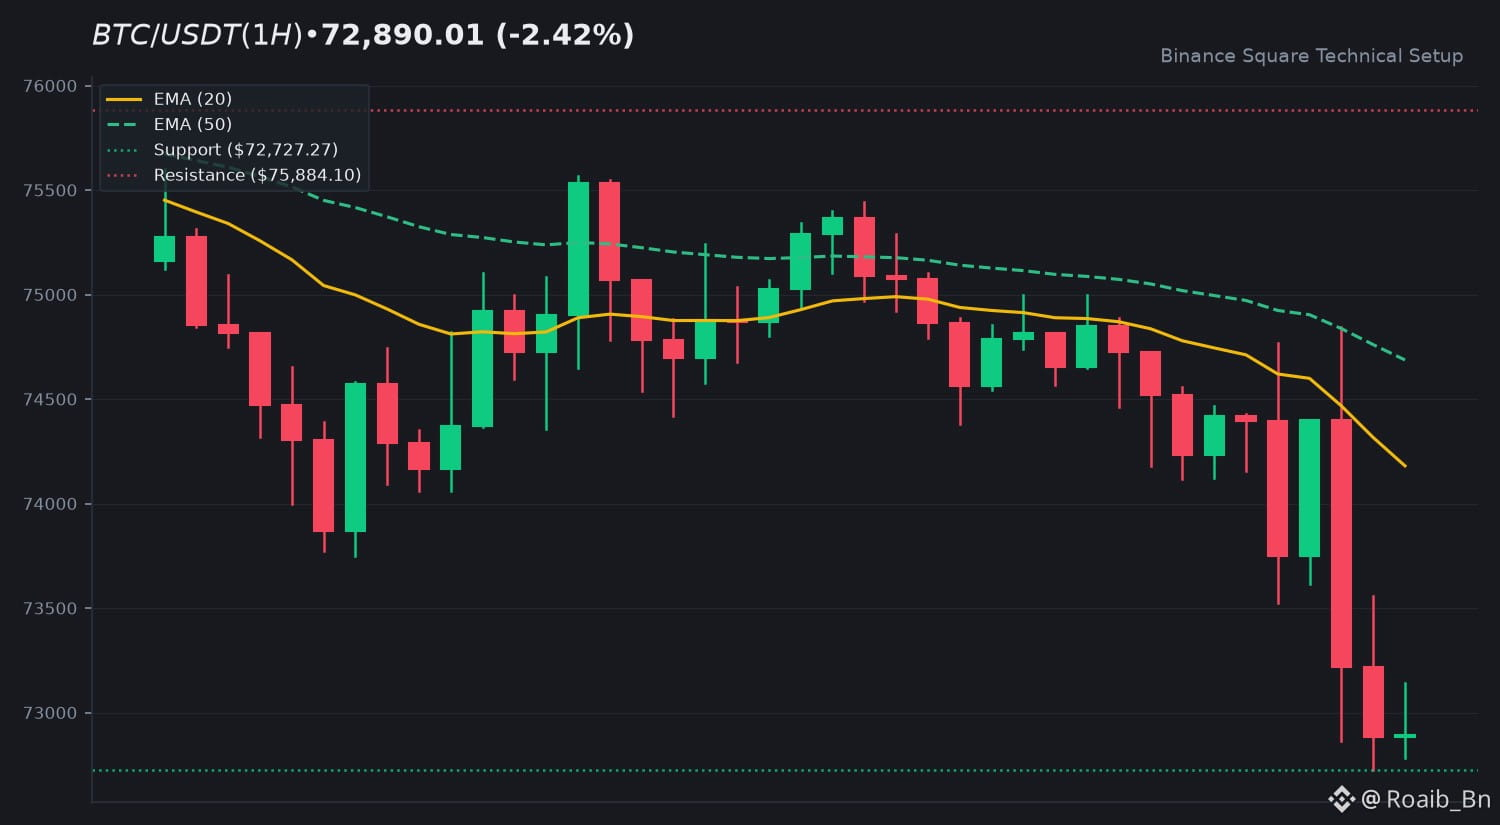
The current price of 72,890.01 reflects a period of consolidation within a broader downtrend. Price action remains positioned below both the EMA 20 at 74,180.19 and the EMA 50 at 74,686.90, indicating sustained selling pressure. With an RSI of 31.52, the asset is approaching oversold territory, yet the negative MACD histogram suggests bearish momentum persists. Market participants should monitor the immediate support floor at 72,727.27. Should this level fail to hold, the next focus shifts to lower liquidity pockets. Resistance remains firm at 75,884.10.
2. Ethereum $ETH Technical Outlook
Ethereum $ETH is exhibiting significant volatility, trading at $2,017.72. The asset is currently trailing its EMA 20 at $2,086.19 and EMA 50 at $2,125.06, underscoring a corrective phase. An RSI reading of 23.0 highlights deep oversold conditions, which often invites technical scrutiny regarding potential mean reversion. Key support is located at $2,006.00. Upside recovery requires clearing resistance zones at $2,131.02 and $2,247.73 to shift the current market bias.
3. Macro Confluence & Market Structure
Both assets are currently testing critical support floors amidst a cooling market environment. While $BTC maintains a higher relative strength compared to $ETH, the convergence of EMA indicators suggests a synchronized struggle for trend reversal. The divergence in RSI levels indicates that $ETH is undergoing a more aggressive correction, while $BTC displays slightly higher resilience.
4. Community Discussion
Which asset do you expect to lead momentum this week: $BTC or $ETH? Share below! 👇
⚠️ Educational analysis only. Not financial advice (NFA). DYOR.
$BTC $ETH #BinanceSquare #CryptoMarket
1. Bitcoin $BTC Technical Outlook
The current price of 72,890.01 reflects a period of consolidation within a broader downtrend. Price action remains positioned below both the EMA 20 at 74,180.19 and the EMA 50 at 74,686.90, indicating sustained selling pressure. With an RSI of 31.52, the asset is approaching oversold territory, yet the negative MACD histogram suggests bearish momentum persists. Market participants should monitor the immediate support floor at 72,727.27. Should this level fail to hold, the next focus shifts to lower liquidity pockets. Resistance remains firm at 75,884.10.
2. Ethereum $ETH Technical Outlook
Ethereum $ETH is exhibiting significant volatility, trading at $2,017.72. The asset is currently trailing its EMA 20 at $2,086.19 and EMA 50 at $2,125.06, underscoring a corrective phase. An RSI reading of 23.0 highlights deep oversold conditions, which often invites technical scrutiny regarding potential mean reversion. Key support is located at $2,006.00. Upside recovery requires clearing resistance zones at $2,131.02 and $2,247.73 to shift the current market bias.
3. Macro Confluence & Market Structure
Both assets are currently testing critical support floors amidst a cooling market environment. While $BTC maintains a higher relative strength compared to $ETH, the convergence of EMA indicators suggests a synchronized struggle for trend reversal. The divergence in RSI levels indicates that $ETH is undergoing a more aggressive correction, while $BTC displays slightly higher resilience.
4. Community Discussion
Which asset do you expect to lead momentum this week: $BTC or $ETH? Share below! 👇
⚠️ Educational analysis only. Not financial advice (NFA). DYOR.
$BTC $ETH #BinanceSquare #CryptoMarket