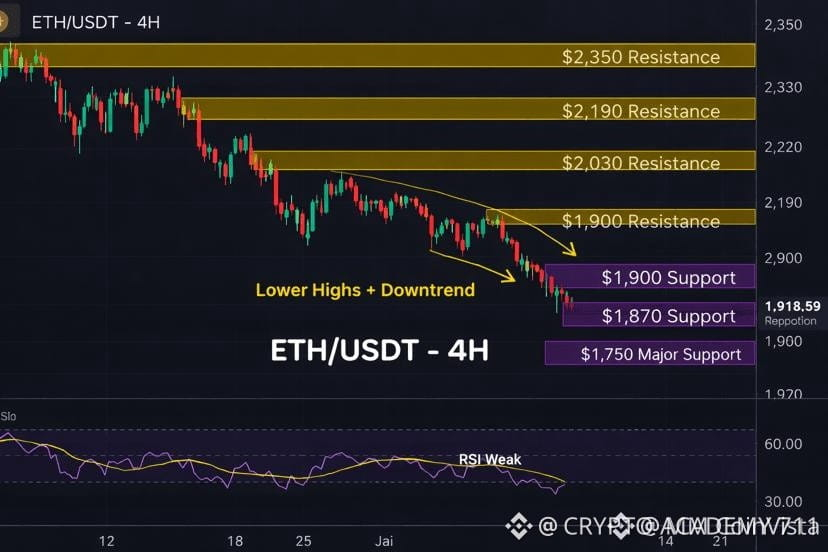
$ETH ETHEREUM LATEST TECHNICAL ANALYSIS | NOVEMBER 10, 2026
💰 Current Price: Around $2,078
📉 Market Trend: Bearish
📊 RSI (14): 31.5
🔴 Resistance Levels
- R1: $2,189
- R2: $2,278
🟢 Support Levels
- S1: $2,076
- S2: $2,016
📉 Market Analysis
Ethereum remains under bearish pressure on both 4H and daily timeframes. RSI is near oversold territory, suggesting a possible short-term relief bounce.
🎯 Trading Strategy
🟢 Bullish Scenario:
A confirmed breakout above $2,189 could open the way toward $2,278.
🔴 Bearish Scenario:
A breakdown below $2,076 could push ETH toward $2,016.
⚠️ My View: Sellers currently have the advantage. Wait for confirmation before entering a trade.
#ETH #Ethereum #CryptoAnalysis #TradingSignals #CryptoMarket
💰 Current Price: Around $2,078
📉 Market Trend: Bearish
📊 RSI (14): 31.5
🔴 Resistance Levels
- R1: $2,189
- R2: $2,278
🟢 Support Levels
- S1: $2,076
- S2: $2,016
📉 Market Analysis
Ethereum remains under bearish pressure on both 4H and daily timeframes. RSI is near oversold territory, suggesting a possible short-term relief bounce.
🎯 Trading Strategy
🟢 Bullish Scenario:
A confirmed breakout above $2,189 could open the way toward $2,278.
🔴 Bearish Scenario:
A breakdown below $2,076 could push ETH toward $2,016.
⚠️ My View: Sellers currently have the advantage. Wait for confirmation before entering a trade.
#ETH #Ethereum #CryptoAnalysis #TradingSignals #CryptoMarket