ZEC Market Alert: Strategic Buy Zones Amidst High Volatility 🚨
$ZEC
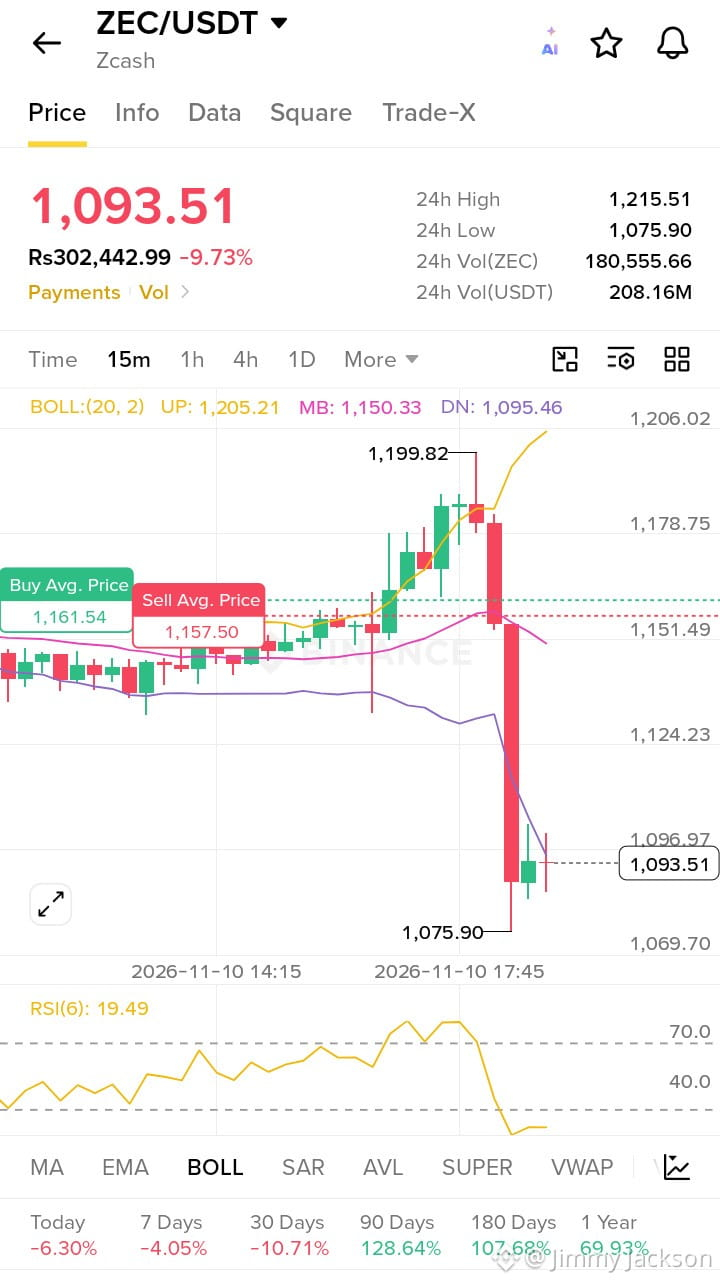
Zcash (ZEC) is currently experiencing a sharp correction, trading at $1,093.51 (down -9.73%). While the 15m chart shows a massive red candle, this pullback may be presenting a strategic entry point. Here is a deep dive into the market mechanics driving this move:
📊 On-Chain & Institutional Flow
· Whale Accumulation: Despite the drop, on-chain data suggests large holders are active. The "Buy Avg. Price" indicator at $1,161.54 suggests previous institutional interest was higher.
· ETF/Institutional Sentiment: The 180-day performance remains an impressive +107.68%. This indicates strong foundational buying; today's dip is likely a healthy retracement rather than a trend reversal.
📉 Technical Breakout & Key Levels
· Oversold Signal: The RSI (6) has plummeted to a critical 19.49, signaling severe oversold conditions. A technical bounce is highly probable.
· Support Zone: Price is testing the lower Bollinger Band support near $1,075.90. If this holds, we could see a swift reversal.
· Resistance: Immediate resistance stands at the mid-Band (MB) of $1,150.33. A breakout above this level confirms the bullish continuation.
⚡ Derivatives & Liquidations
· The sharp wick down to $1,075.90 likely triggered a cascade of long liquidations. However, with funding rates resetting, the "short squeeze" fuel is building. Bears may be caught off guard if price reclaims $1,100 quickly.
🎯 Key Targets
· Entry Zone: Current levels to $1,075
· Target 1: $1,150 (Bollinger MB)
· Target 2: $1,200 (Recent High)
Please don’t forget to like, follow, and share! 🩸 Thank you so much ❤️
#HotCPIDecemberHikePriced #AnthropicRejectsIPODelayValuationinQuestion #NvidiaInvestigatesAfterHuang’sAffairApology
$ZEC
Zcash (ZEC) is currently experiencing a sharp correction, trading at $1,093.51 (down -9.73%). While the 15m chart shows a massive red candle, this pullback may be presenting a strategic entry point. Here is a deep dive into the market mechanics driving this move:
📊 On-Chain & Institutional Flow
· Whale Accumulation: Despite the drop, on-chain data suggests large holders are active. The "Buy Avg. Price" indicator at $1,161.54 suggests previous institutional interest was higher.
· ETF/Institutional Sentiment: The 180-day performance remains an impressive +107.68%. This indicates strong foundational buying; today's dip is likely a healthy retracement rather than a trend reversal.
📉 Technical Breakout & Key Levels
· Oversold Signal: The RSI (6) has plummeted to a critical 19.49, signaling severe oversold conditions. A technical bounce is highly probable.
· Support Zone: Price is testing the lower Bollinger Band support near $1,075.90. If this holds, we could see a swift reversal.
· Resistance: Immediate resistance stands at the mid-Band (MB) of $1,150.33. A breakout above this level confirms the bullish continuation.
⚡ Derivatives & Liquidations
· The sharp wick down to $1,075.90 likely triggered a cascade of long liquidations. However, with funding rates resetting, the "short squeeze" fuel is building. Bears may be caught off guard if price reclaims $1,100 quickly.
🎯 Key Targets
· Entry Zone: Current levels to $1,075
· Target 1: $1,150 (Bollinger MB)
· Target 2: $1,200 (Recent High)
Please don’t forget to like, follow, and share! 🩸 Thank you so much ❤️
#HotCPIDecemberHikePriced #AnthropicRejectsIPODelayValuationinQuestion #NvidiaInvestigatesAfterHuang’sAffairApology