📈 SNDK — BOUNCE & TESTING MOVING AVERAGE RESISTANCE! 🔄
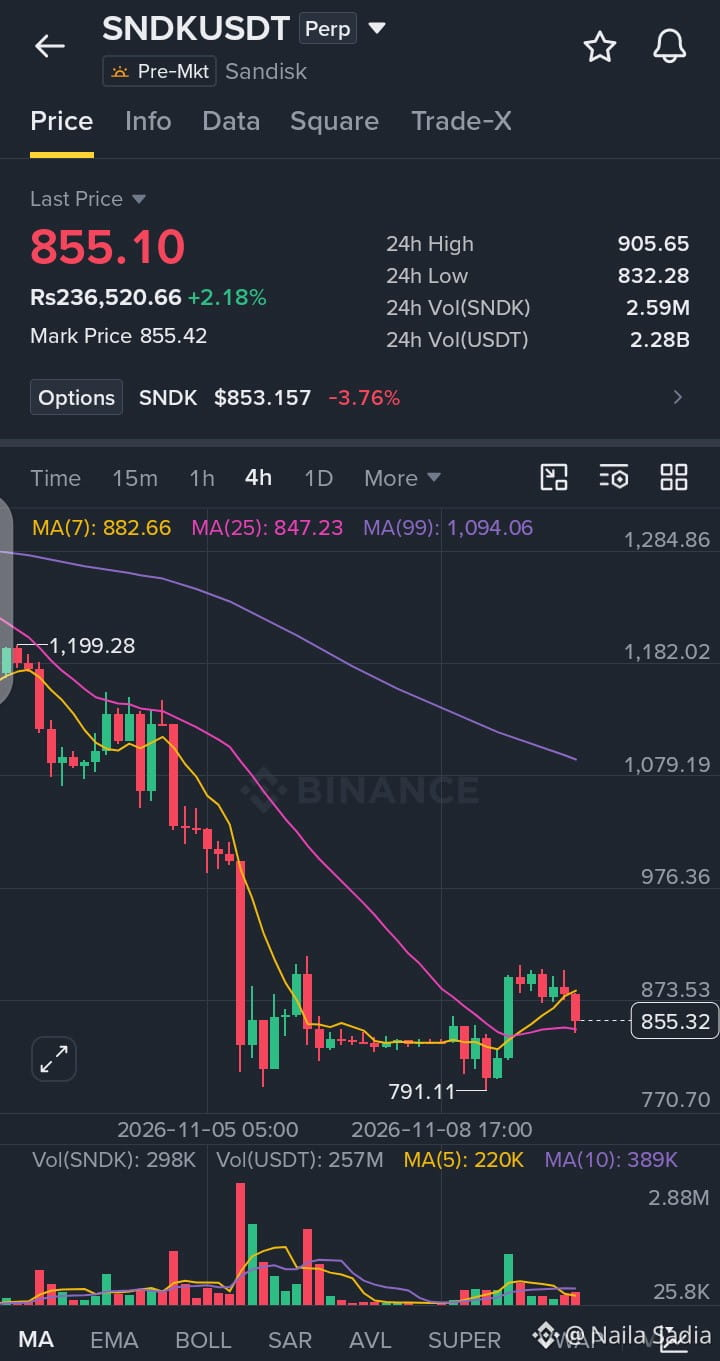
$SNDK is trading up at 855.10 (+2.18%, or roughly Rs236,520.66), moving within an active 24-hour range between a high of 905.65 and a low of 832.28. Price action on this 4-hour chart displays a recovery bounce following the sharp correction down to the 791.11 swing low, hovering right near the fast MA(7) (882.66 — note: currently crossing above fast price action) and reclaiming the rising MA(25) (847.23) while remaining suppressed below the macro structural MA(99) (1,094.06) moving average.
📊 QUICK TRADE PLAN — 4H
🟢 LONG ENTRY: 810.00–845.00 (on healthy intraday retracements or retests of the MA(25) support base)
🛑 STOP LOSS: 780.00
🎯 TP1: 910.00
🎯 TP2: 980.00
❓Are you watching for SNDK to sustain this momentum and push toward the $905+ resistance level, or expecting a retest of the lower moving average supports?
Let's discuss below! 👇
👉 Trade: $SNDK
#SNDK #cryptotrading #BinanceSquare #Bullish #TradingSignal
$SNDK is trading up at 855.10 (+2.18%, or roughly Rs236,520.66), moving within an active 24-hour range between a high of 905.65 and a low of 832.28. Price action on this 4-hour chart displays a recovery bounce following the sharp correction down to the 791.11 swing low, hovering right near the fast MA(7) (882.66 — note: currently crossing above fast price action) and reclaiming the rising MA(25) (847.23) while remaining suppressed below the macro structural MA(99) (1,094.06) moving average.
📊 QUICK TRADE PLAN — 4H
🟢 LONG ENTRY: 810.00–845.00 (on healthy intraday retracements or retests of the MA(25) support base)
🛑 STOP LOSS: 780.00
🎯 TP1: 910.00
🎯 TP2: 980.00
❓Are you watching for SNDK to sustain this momentum and push toward the $905+ resistance level, or expecting a retest of the lower moving average supports?
Let's discuss below! 👇
👉 Trade: $SNDK
#SNDK #cryptotrading #BinanceSquare #Bullish #TradingSignal