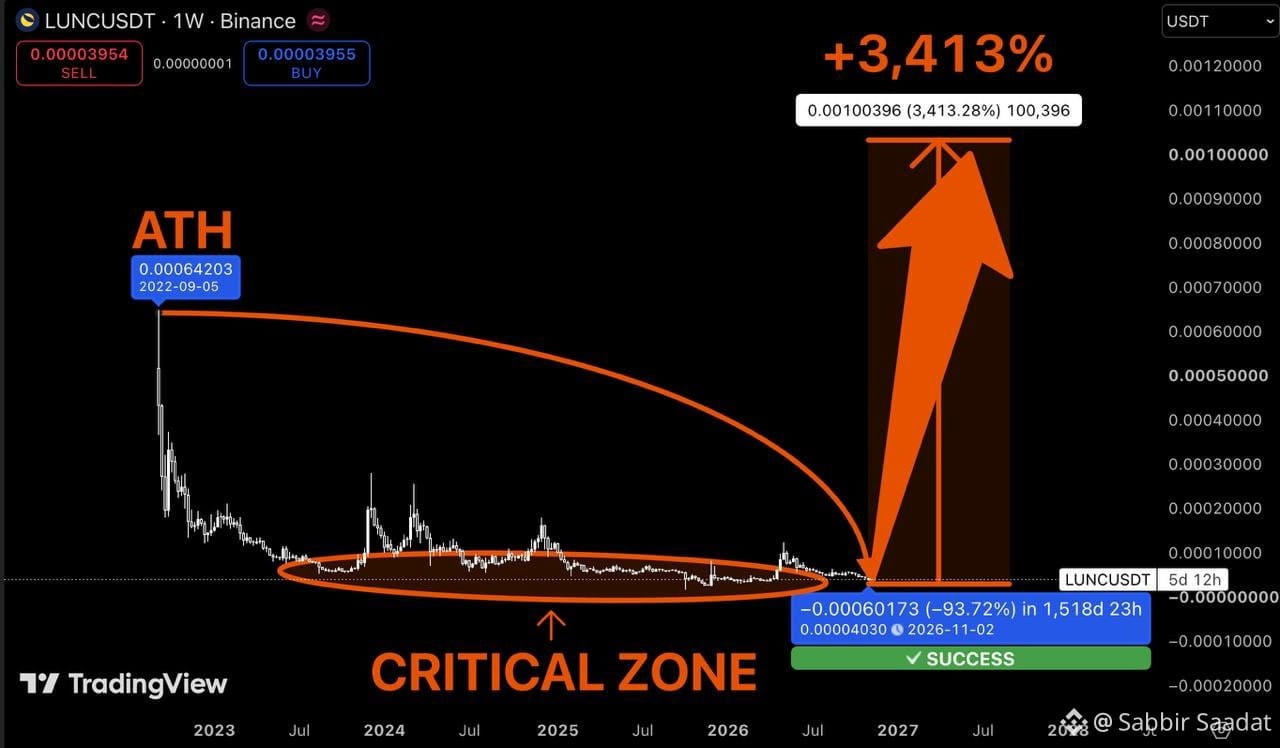

$LUNC is trading around $0.0000395.
And this weekly chart is sitting at a critical point.
Back in September 2022, $LUNC reached $0.00064.
Since then, it's lost more than 93% of its value.
Years of lower highs. Failed rallies. Constant selling pressure.
But look at the bigger picture.
Price has spent several years moving inside the same broad support region, repeatedly returning to the lows.
Now $LUNC is testing that critical zone once again.
And this is where I'm watching for a potential shift.
If buyers can defend $0.00004 and reclaim $0.00010, the structure could start improving.
Then $0.00020 becomes the next major area to watch.
Above that, $0.00064 — the previous major high on this chart — comes into focus.
And $0.001? That's my extreme bull scenario.
The chart illustrates a potential 3,413% rally from its marked historical reference point.
But let's not confuse potential with probability.
For a move of that magnitude, LUNC would need sustained demand, a decisive weekly breakout, and a major change in market sentiment.
Its circulating supply also makes aggressive price targets especially challenging.
And if the current support zone breaks, the recovery thesis weakens significantly.
Still, there's a reason I'm watching this chart.
Sometimes a multi-year base becomes the foundation for a major reversal.
Other times, it's simply a pause before another leg down.
What matters now isn't the size of the arrow.
It's whether buyers can finally break the bearish structure.
And this weekly chart is sitting at a critical point.
Back in September 2022, $LUNC reached $0.00064.
Since then, it's lost more than 93% of its value.
Years of lower highs. Failed rallies. Constant selling pressure.
But look at the bigger picture.
Price has spent several years moving inside the same broad support region, repeatedly returning to the lows.
Now $LUNC is testing that critical zone once again.
And this is where I'm watching for a potential shift.
If buyers can defend $0.00004 and reclaim $0.00010, the structure could start improving.
Then $0.00020 becomes the next major area to watch.
Above that, $0.00064 — the previous major high on this chart — comes into focus.
And $0.001? That's my extreme bull scenario.
The chart illustrates a potential 3,413% rally from its marked historical reference point.
But let's not confuse potential with probability.
For a move of that magnitude, LUNC would need sustained demand, a decisive weekly breakout, and a major change in market sentiment.
Its circulating supply also makes aggressive price targets especially challenging.
And if the current support zone breaks, the recovery thesis weakens significantly.
Still, there's a reason I'm watching this chart.
Sometimes a multi-year base becomes the foundation for a major reversal.
Other times, it's simply a pause before another leg down.
What matters now isn't the size of the arrow.
It's whether buyers can finally break the bearish structure.