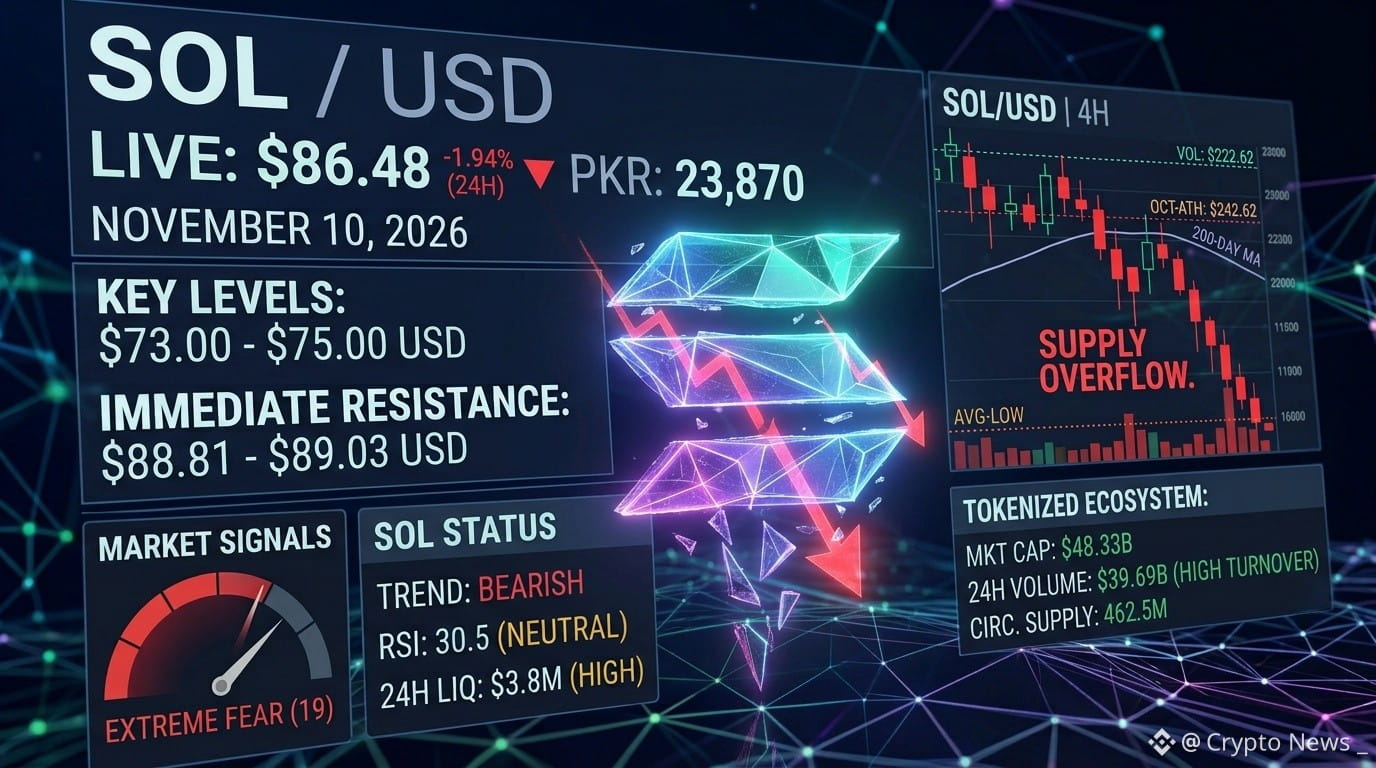
Solana ($SOL ) is trading within a high-stakes, information-dense range, priced at approximately $86.48 USD (equivalent to Rs. 23,870 PKR) as of November 10, 2026. The asset is at a defining structural junction, testing significant moving averages while absorbing mixed macro signals.
Key Technical Levels & Market Metrics
Support Zones: Immediate and defining technical support rests in the $83.05 to $84.64 band. This region serves as the local floor and psychological defense. A confirmed failure here risks triggering a liquidation flush, targeting the critical macro structural bottom identified at $73.00 to $75.00.
Resistance Barriers: Overhead supply and severe selling pressure are clustered tightly between $88.81 and $89.03. The $89.03 level is reinforced by the highly-consequential 200-day Simple Moving Average (SMA), which is currently the defining ceiling. A sustained, high-volume break above this SMA is mandatory to flip short-term momentum from neutral-bearish back to bullish, opening the path to retest the $95.00 psychological barrier.
Sentiment & Volume Context: Sentiment has stabilized but remains extremely cautious. Market indicators are mixed; the Relative Strength Index (RSI) is slightly bearish near 30, approaching oversold territory, suggesting a potential bounce. However, sustained network use and on-chain activity contrast with ongoing spot ETF net outflows, which are currently a major headwind for the asset's price expansion.
$SOL
#solana #CPITestsDecemberRateOutlook #BitcoinFiveWeeklyLosses #NvidiaInvestigatesAfterHuang’sAffairApology #AnthropicRejectsIPODelayValuationinQuestion
Key Technical Levels & Market Metrics
Support Zones: Immediate and defining technical support rests in the $83.05 to $84.64 band. This region serves as the local floor and psychological defense. A confirmed failure here risks triggering a liquidation flush, targeting the critical macro structural bottom identified at $73.00 to $75.00.
Resistance Barriers: Overhead supply and severe selling pressure are clustered tightly between $88.81 and $89.03. The $89.03 level is reinforced by the highly-consequential 200-day Simple Moving Average (SMA), which is currently the defining ceiling. A sustained, high-volume break above this SMA is mandatory to flip short-term momentum from neutral-bearish back to bullish, opening the path to retest the $95.00 psychological barrier.
Sentiment & Volume Context: Sentiment has stabilized but remains extremely cautious. Market indicators are mixed; the Relative Strength Index (RSI) is slightly bearish near 30, approaching oversold territory, suggesting a potential bounce. However, sustained network use and on-chain activity contrast with ongoing spot ETF net outflows, which are currently a major headwind for the asset's price expansion.
$SOL
#solana #CPITestsDecemberRateOutlook #BitcoinFiveWeeklyLosses #NvidiaInvestigatesAfterHuang’sAffairApology #AnthropicRejectsIPODelayValuationinQuestion