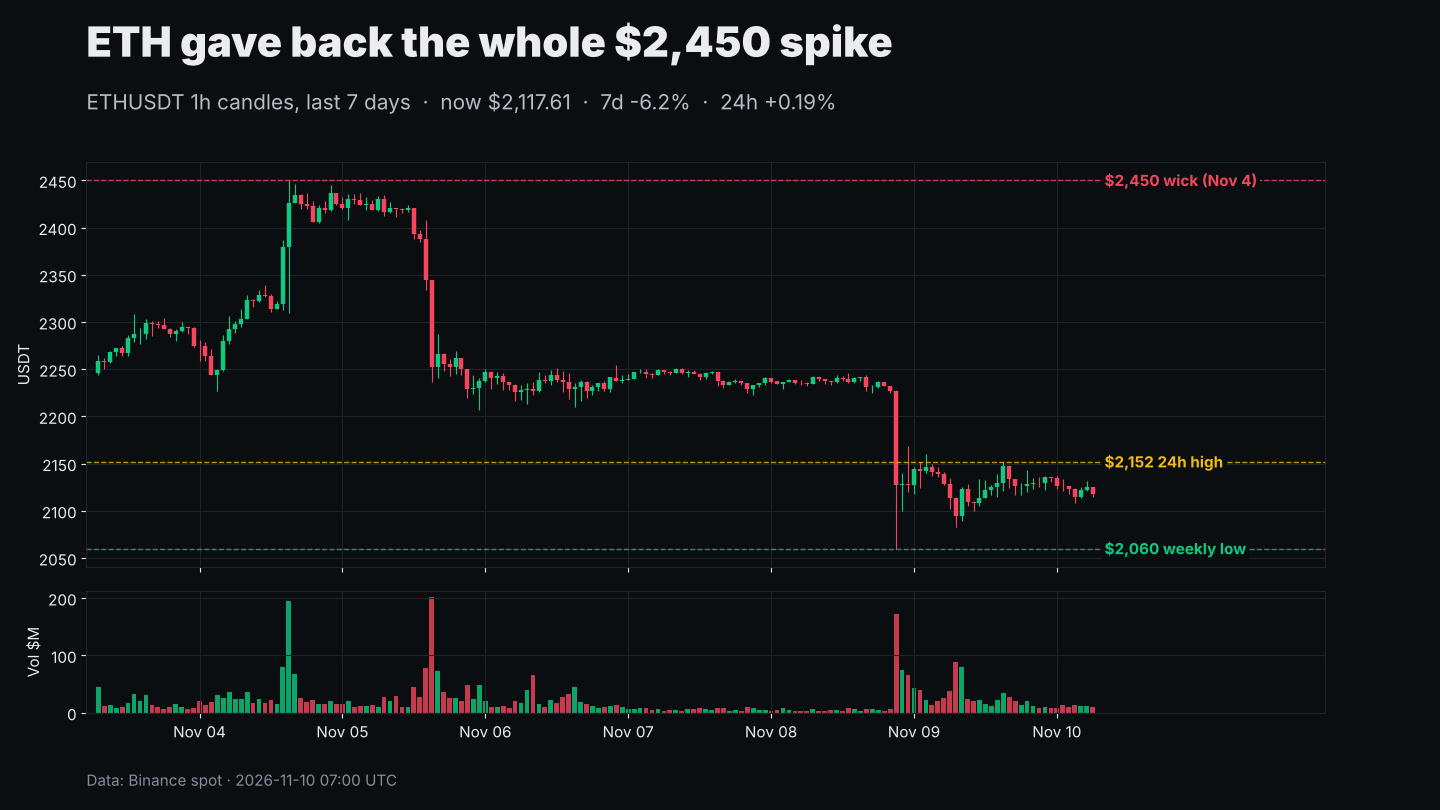
$ETH printed $2,450 on Nov 4. Six days later it's sitting at $2,117 and the whole spike is gone.
How it unfolded on the 1h chart:
• Nov 4: one candle ripped from $2,379 to a $2,450 wick on ~$194M volume
• Nov 5: a single red hour wiped it, $2,344 down to $2,253 on ~$202M
• Nov 8, 21:00 UTC: flush to $2,060, then an instant bounce back to $2,127
Since that flush it's been a tight box. 24h range $2,083–$2,152, price +0.19% on the day, 7d -6.2%, and 24h volume ($519M) is right in line with the weekly average. Nobody is pressing either side.
Relative strength isn't helping. ETH/BTC slid from 0.02953 to 0.02838 in three days while BTC holds around $74.6K.
Levels I'm watching:
– $2,152: reclaim it and $2,230–2,250 (the old range floor) comes back into play
– $2,083 / $2,060: lose these and the wick low gets retested for real
Range traders are happy here. Trend traders should probably wait for one side to break.
Which side breaks first for ETH?
Not financial advice.
#ETH #Ethereum #CryptoTrading
How it unfolded on the 1h chart:
• Nov 4: one candle ripped from $2,379 to a $2,450 wick on ~$194M volume
• Nov 5: a single red hour wiped it, $2,344 down to $2,253 on ~$202M
• Nov 8, 21:00 UTC: flush to $2,060, then an instant bounce back to $2,127
Since that flush it's been a tight box. 24h range $2,083–$2,152, price +0.19% on the day, 7d -6.2%, and 24h volume ($519M) is right in line with the weekly average. Nobody is pressing either side.
Relative strength isn't helping. ETH/BTC slid from 0.02953 to 0.02838 in three days while BTC holds around $74.6K.
Levels I'm watching:
– $2,152: reclaim it and $2,230–2,250 (the old range floor) comes back into play
– $2,083 / $2,060: lose these and the wick low gets retested for real
Range traders are happy here. Trend traders should probably wait for one side to break.
Which side breaks first for ETH?
Not financial advice.
#ETH #Ethereum #CryptoTrading